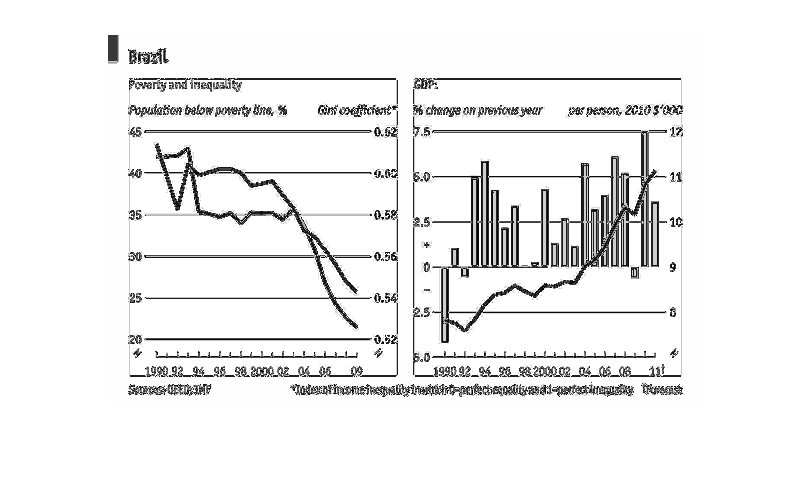
This char depicts the inequality and poverty rates in Brazil as they have changed between
1990 and 2009, and then shows the change against the previous year as it relates to each person.
Error using .*
Matrix dimensions must agree.

Error in plotSpotlight (line 30)
    output = repmat(a,[1 1 3]).*single(im)/255;

Error in plot_individual_user_maps (line 49)
        [heat] = plotSpotlight(im,heatmap,3);