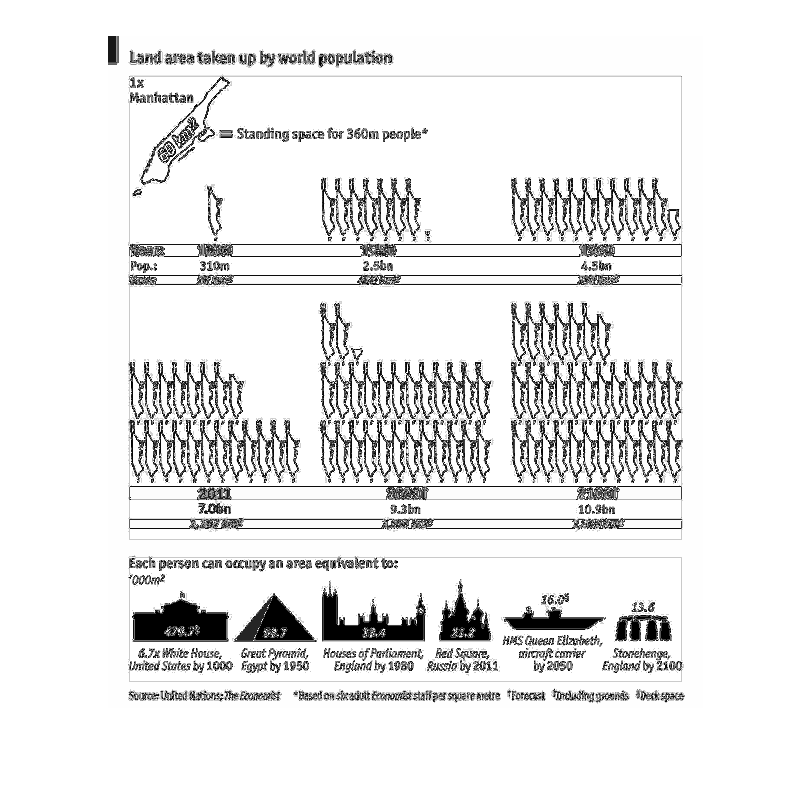
This graph describes land taken up by population over time. It's describing Manhattan starting
in the year 1000 and ending with estimates for the year 2100. 60 km2 is measured as standing
space for 360 million people.
Error using .*
Matrix dimensions must agree.

Error in plotSpotlight (line 30)
    output = repmat(a,[1 1 3]).*single(im)/255;

Error in plot_individual_user_maps (line 49)
        [heat] = plotSpotlight(im,heatmap,3);