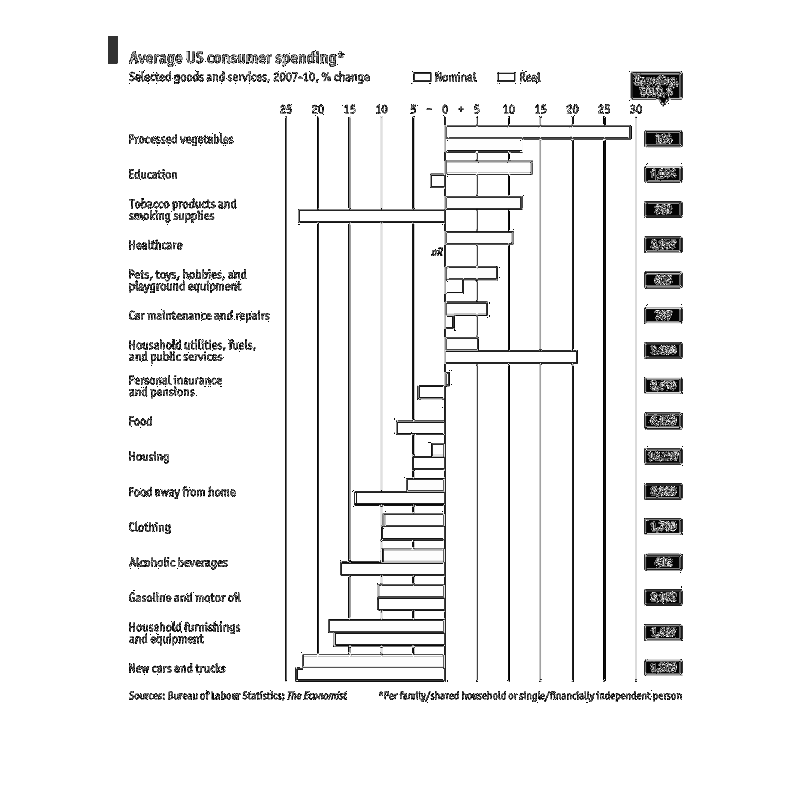
This graph includes the us consumer spending on selected goods and services from 2007-2010
in % change. The items listed includes Processed veggies, Education, Tobacco, Healthcare,
pets, car maintenance, Household utilities, Personal insurance and Pensions, food, housing,
food away from home, clothing, alcohol, gas, home furnishings, new cars.
Error using .*
Matrix dimensions must agree.

Error in plotSpotlight (line 30)
    output = repmat(a,[1 1 3]).*single(im)/255;

Error in plot_individual_user_maps (line 49)
        [heat] = plotSpotlight(im,heatmap,3);