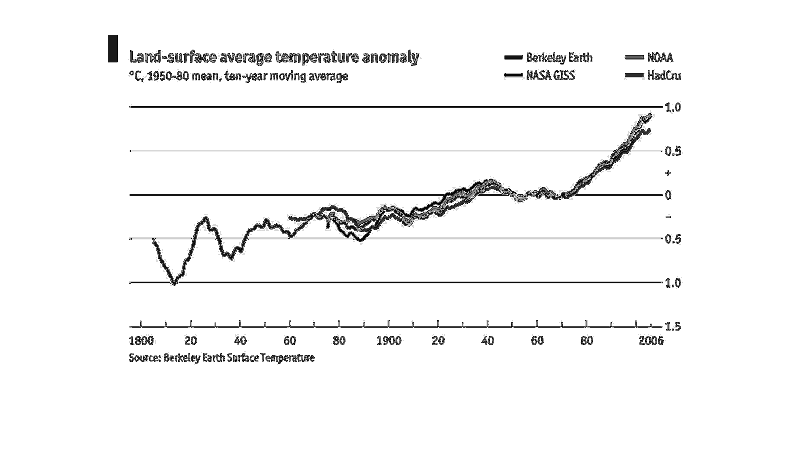
This shows anomalies of land-surface temperatures with ten-year averages using 1950-80 as
standard and four viewpoints of it. It looks at the overall rise from 1800 to present, showing
an accelerated increase in recent years.
Error using .*
Matrix dimensions must agree.

Error in plotSpotlight (line 30)
    output = repmat(a,[1 1 3]).*single(im)/255;

Error in plot_individual_user_maps (line 49)
        [heat] = plotSpotlight(im,heatmap,3);