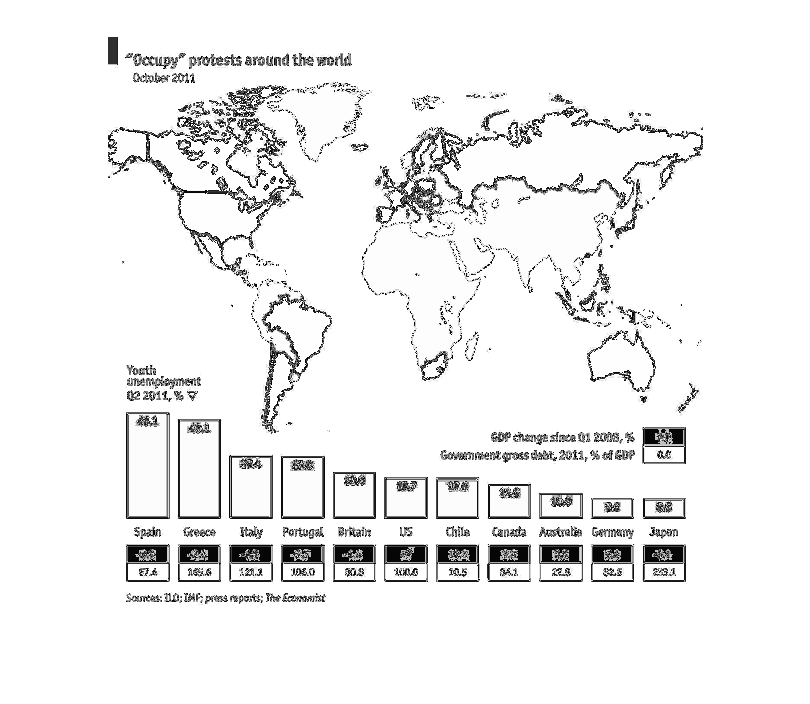
This graph describes the occupy protest movement around the world in October of 2011. It shows
the youth unemployment and also the gross debt from 2011.
Error using .*
Matrix dimensions must agree.

Error in plotSpotlight (line 30)
    output = repmat(a,[1 1 3]).*single(im)/255;

Error in plot_individual_user_maps (line 49)
        [heat] = plotSpotlight(im,heatmap,3);