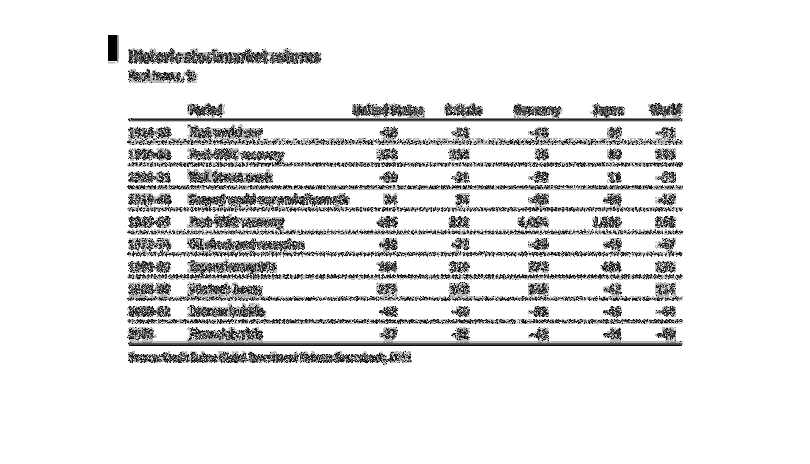
This graph displays historic stock market returns from the time of 1914 to the year 2008.
 It reflects them for the world and then for the individual countries of US, Britain, Germany
and Japan.
Error using .*
Matrix dimensions must agree.

Error in plotSpotlight (line 30)
    output = repmat(a,[1 1 3]).*single(im)/255;

Error in plot_individual_user_maps (line 49)
        [heat] = plotSpotlight(im,heatmap,3);