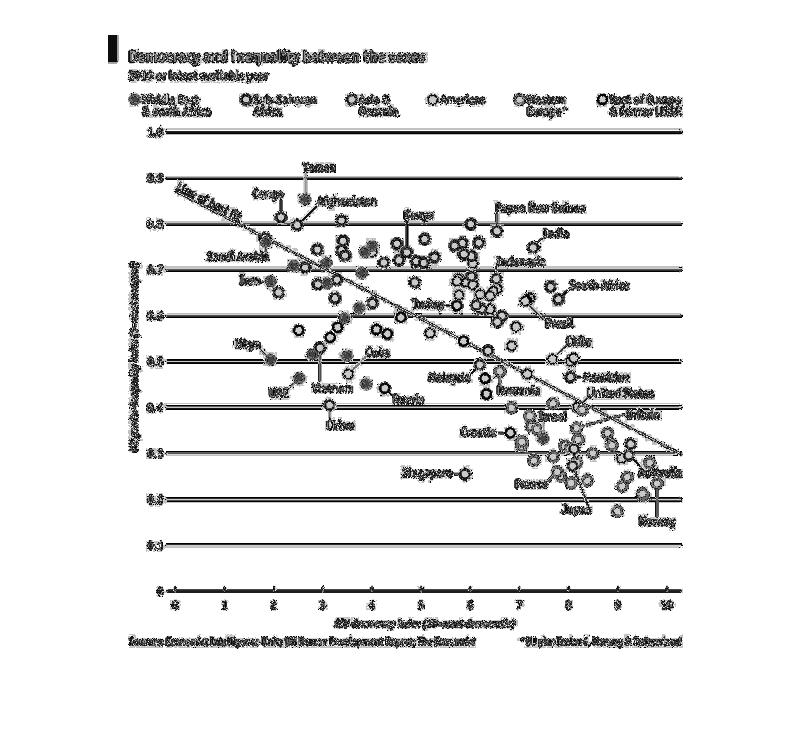
This scatter plot depicts democracy and the inequality of sexes around the world. We can see
that the overall trend is certainly decreasing meaning as time goes by, sex inequality decreases.
Error using .*
Matrix dimensions must agree.

Error in plotSpotlight (line 30)
    output = repmat(a,[1 1 3]).*single(im)/255;

Error in plot_individual_user_maps (line 49)
        [heat] = plotSpotlight(im,heatmap,3);