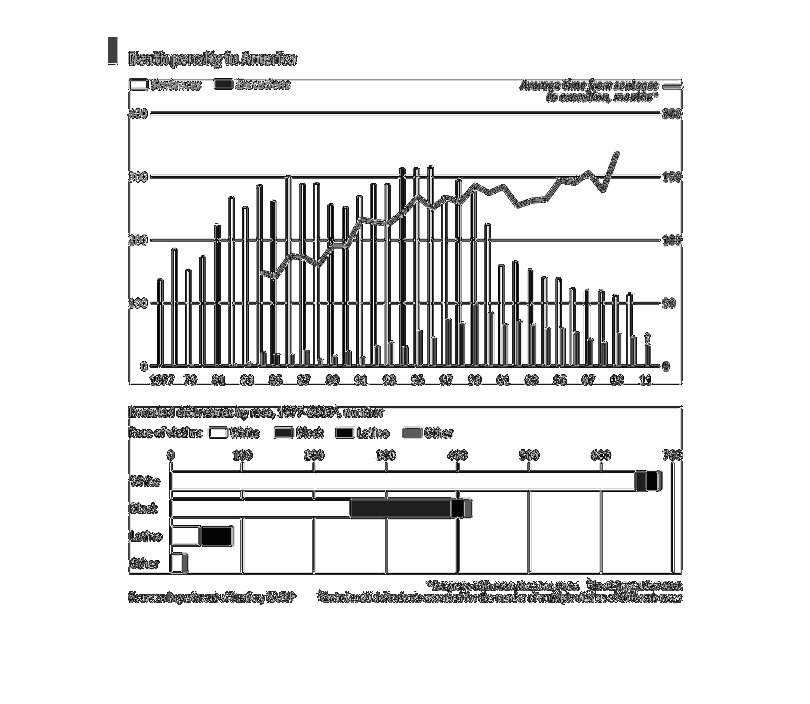
The chart is the death penalty in America from 1977 to 2011 with it divided among different
races. It shows more white people have received the death penalty than any others over the
given period of time.
Error using .*
Matrix dimensions must agree.

Error in plotSpotlight (line 30)
    output = repmat(a,[1 1 3]).*single(im)/255;

Error in plot_individual_user_maps (line 49)
        [heat] = plotSpotlight(im,heatmap,3);