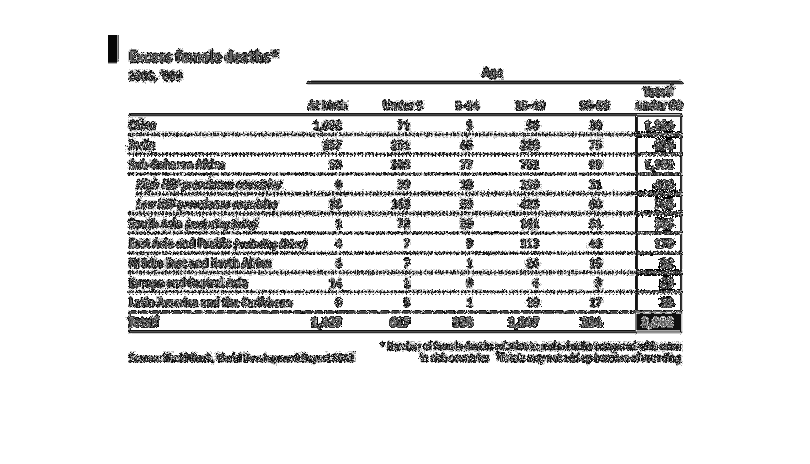
The image provides the number of female deaths compared to male deaths, compared with rates
in rich countries, from 2008. Data is broken down in terms of age groups.
Error using .*
Matrix dimensions must agree.

Error in plotSpotlight (line 30)
    output = repmat(a,[1 1 3]).*single(im)/255;

Error in plot_individual_user_maps (line 49)
        [heat] = plotSpotlight(im,heatmap,3);