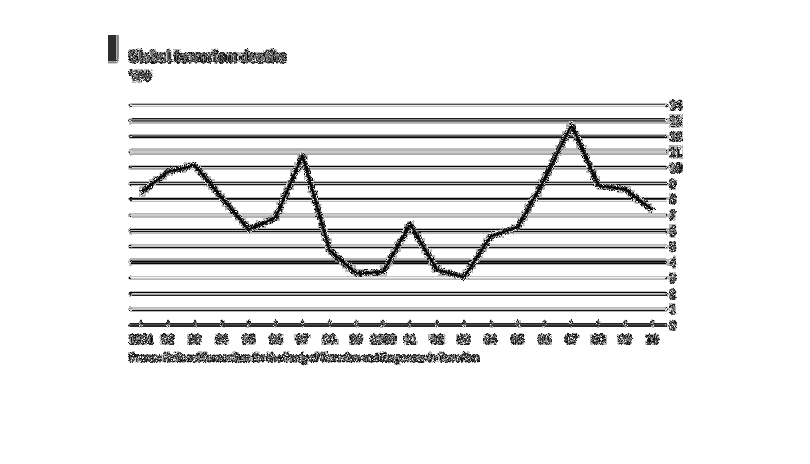
This chart shows the fluctuating number of deaths due to global terrorism between the years
1991 and 2010. The year 1999 shows the lowest number while 2007 shows the highest.
Error using .*
Matrix dimensions must agree.

Error in plotSpotlight (line 30)
    output = repmat(a,[1 1 3]).*single(im)/255;

Error in plot_individual_user_maps (line 49)
        [heat] = plotSpotlight(im,heatmap,3);