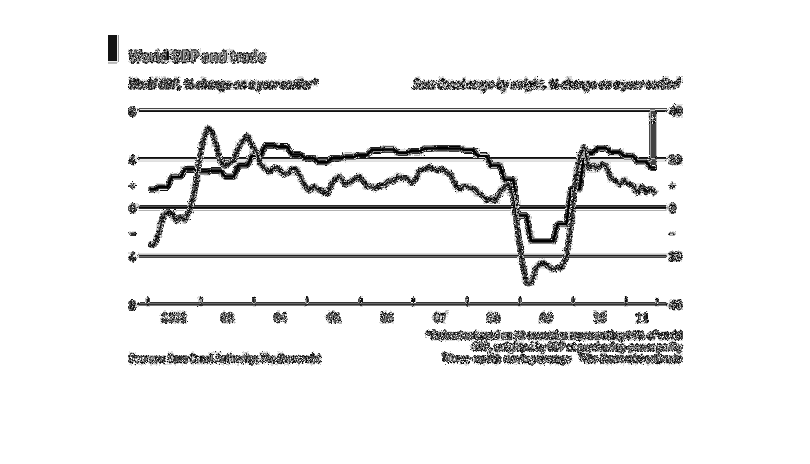
This graph depicts the percent change in World GDP vs Suez Canal cargo by weight from 2002
to 2011. It appears that the graphs mirror each other, with World GDP generally maintaining
4 standard deviations higher than the weight of the cargo. This demonstrates a connection
between the two. The values end higher in 2011 than in 2002, however it is obvious there have
been ups and downs in the market in between.
Error using .*
Matrix dimensions must agree.

Error in plotSpotlight (line 30)
    output = repmat(a,[1 1 3]).*single(im)/255;

Error in plot_individual_user_maps (line 49)
        [heat] = plotSpotlight(im,heatmap,3);