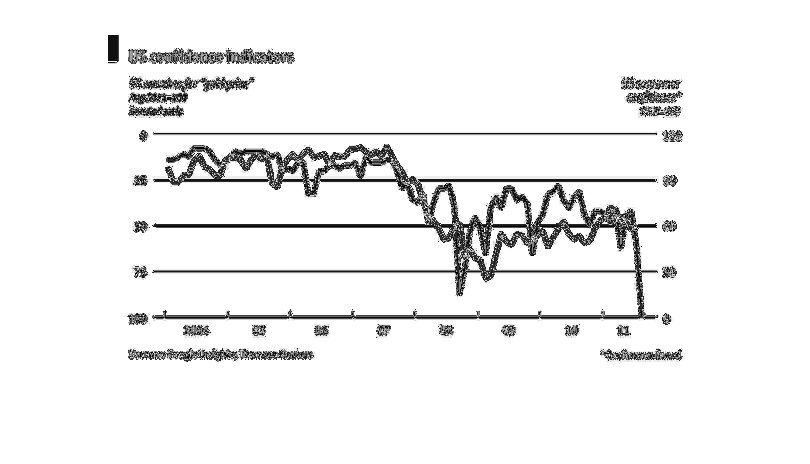
This is a graph of consumer confidence in the United States, between 2004 and 2011, compared
to consumer confidence from 1985-2000 and plotted against the inverse of searches for "gold
prices" on the internet. Consumer confidence has been steadily falling since 2004, with major
dips in 2008 and 2011.
Error using .*
Matrix dimensions must agree.

Error in plotSpotlight (line 30)
    output = repmat(a,[1 1 3]).*single(im)/255;

Error in plot_individual_user_maps (line 49)
        [heat] = plotSpotlight(im,heatmap,3);