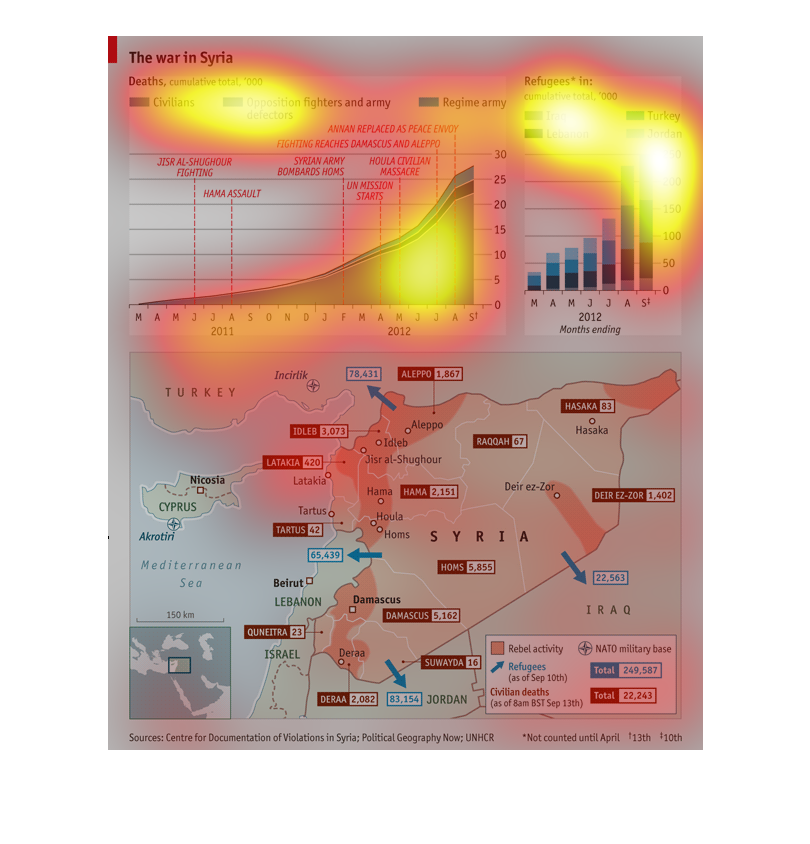
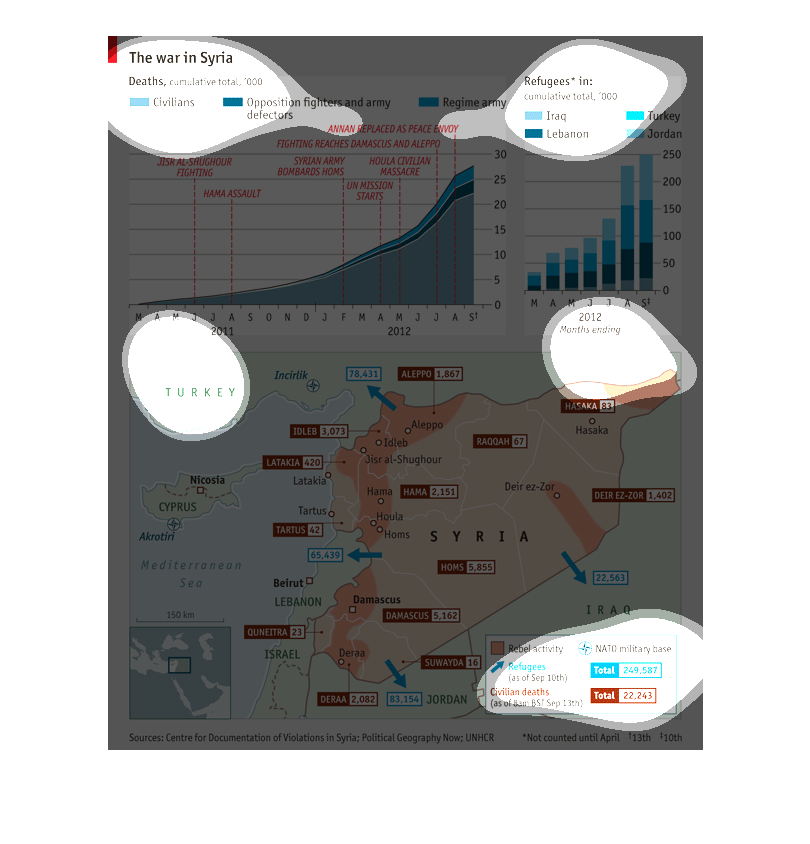
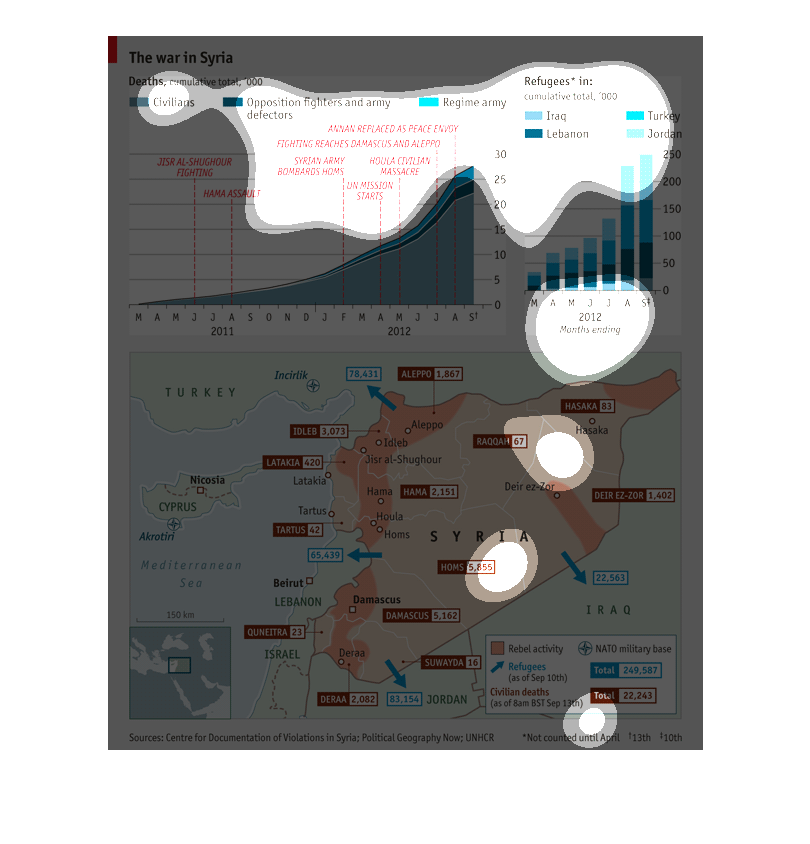
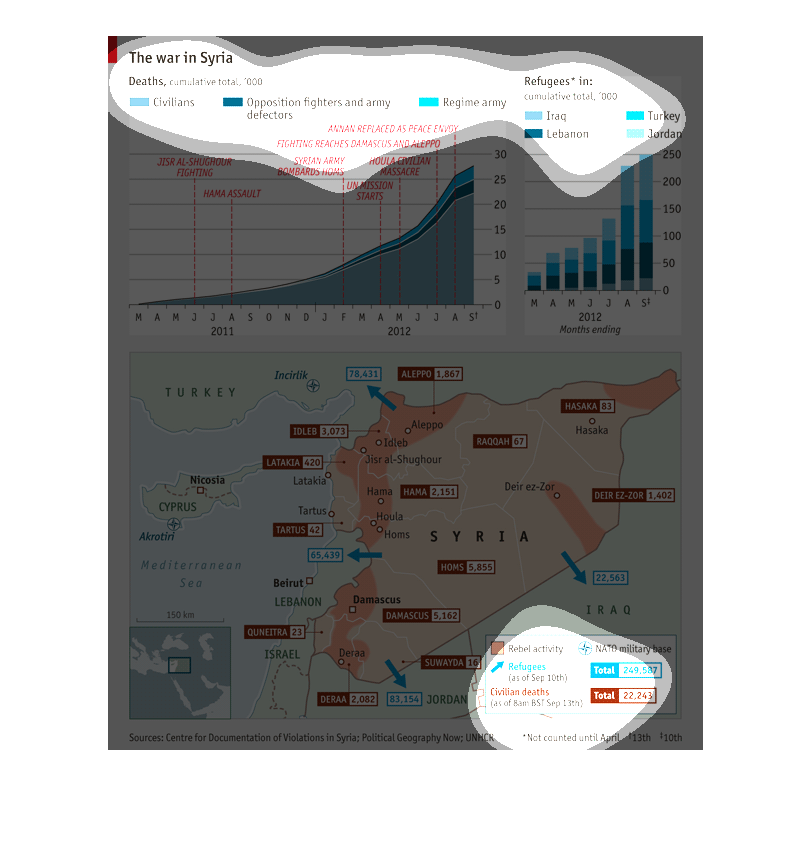
This image describes the war in Syria. The graph on the top left describes the death tolls
between civilians and fighters and the army. The graph on the right shows  the amount of refugees
in different countries.
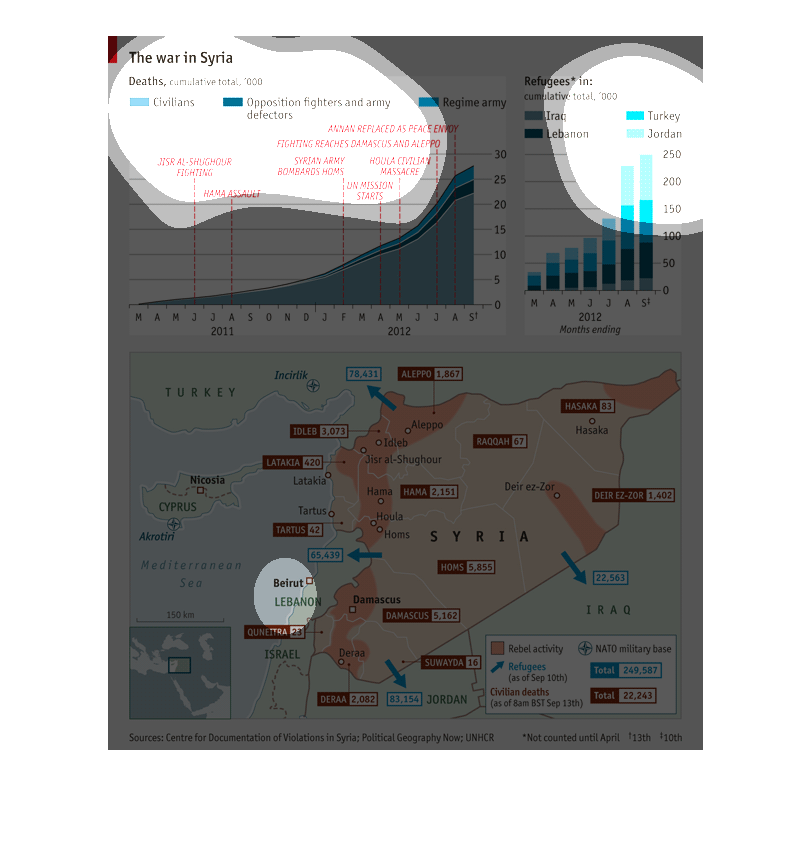
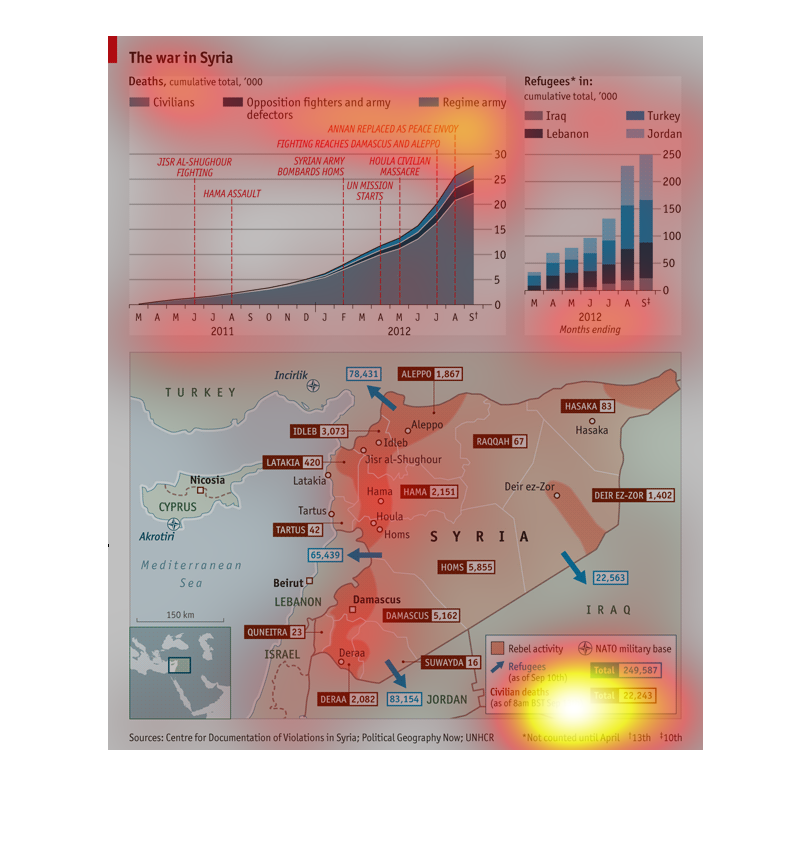
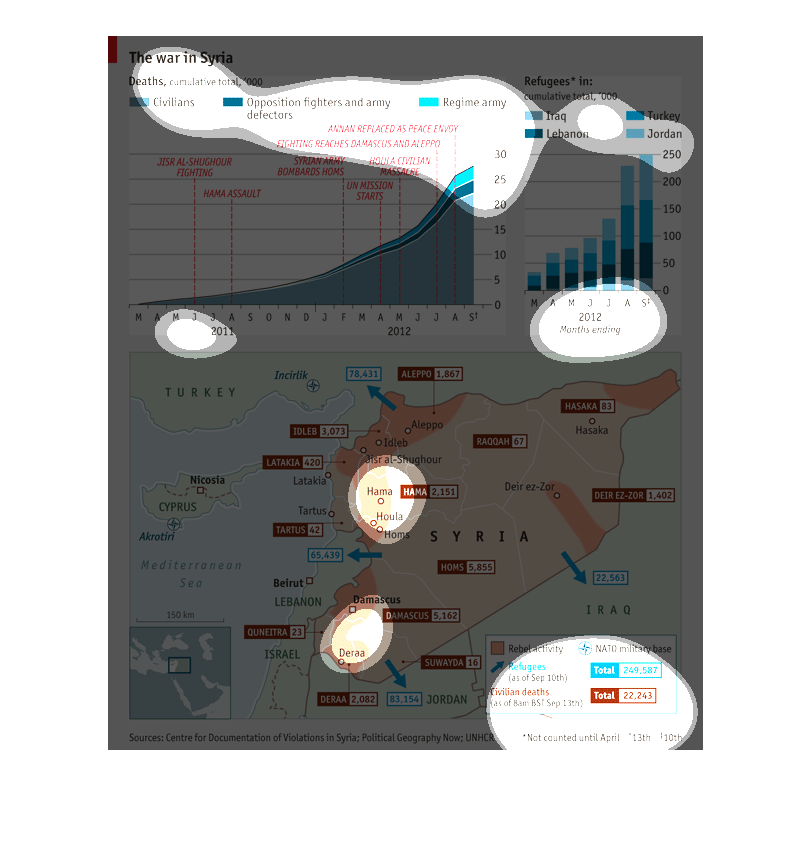
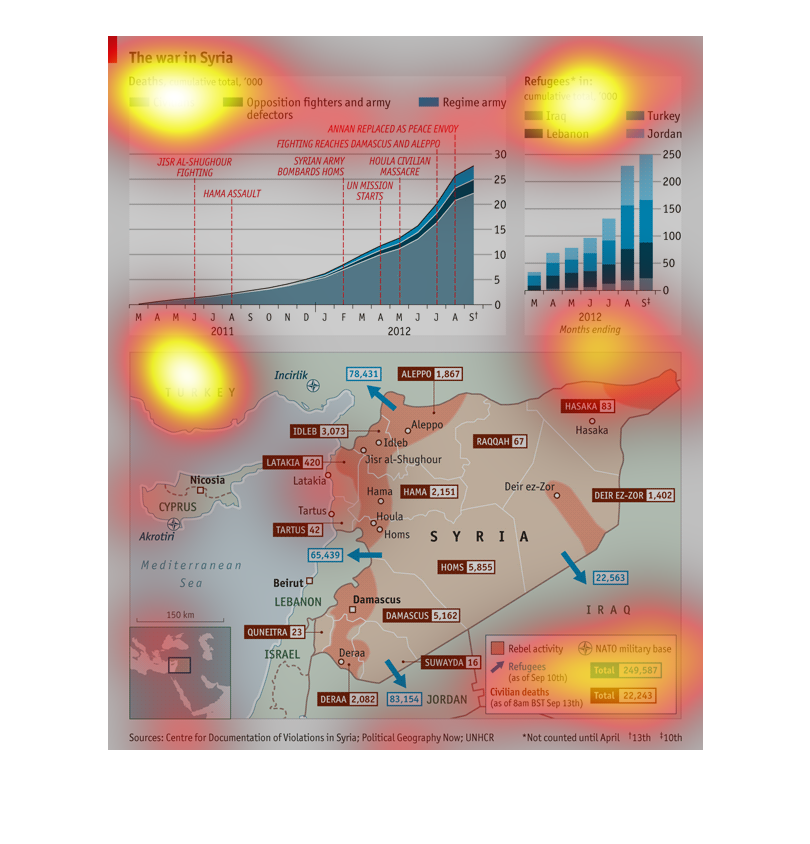
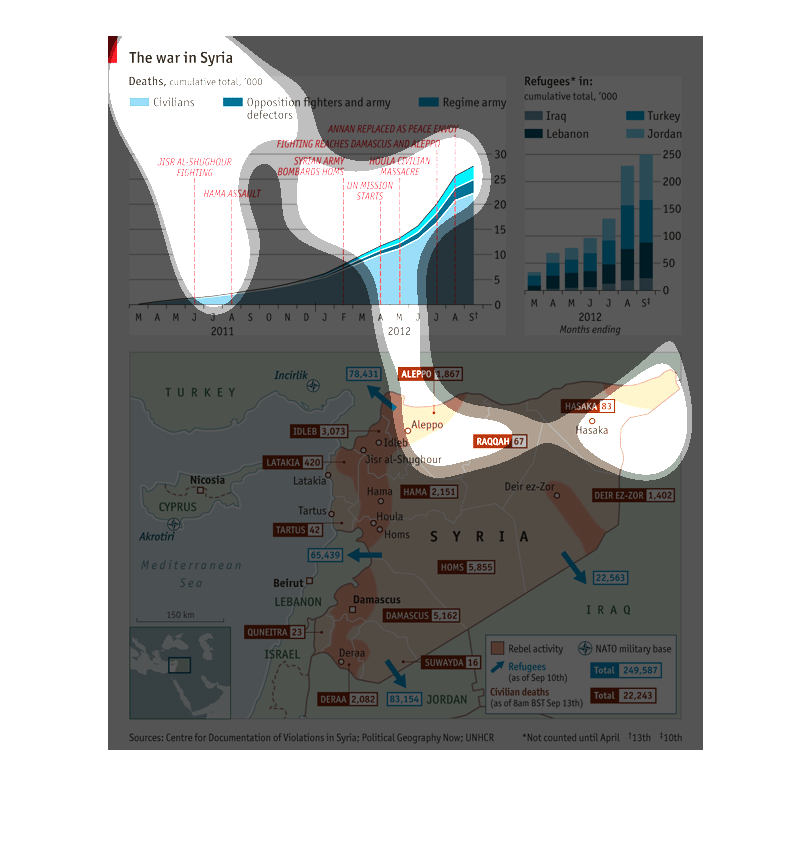
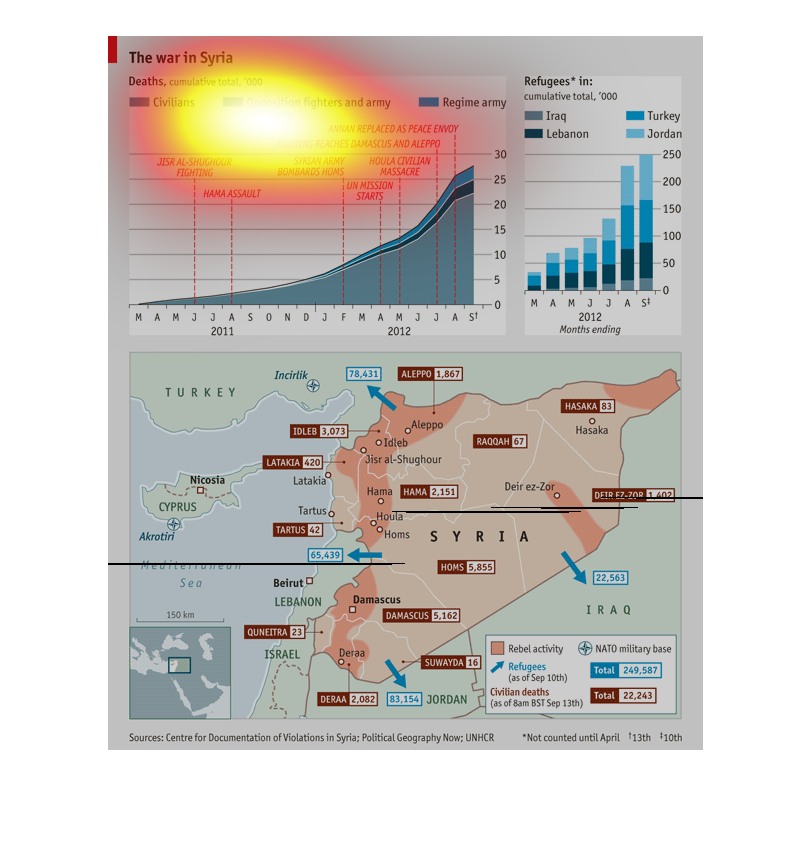
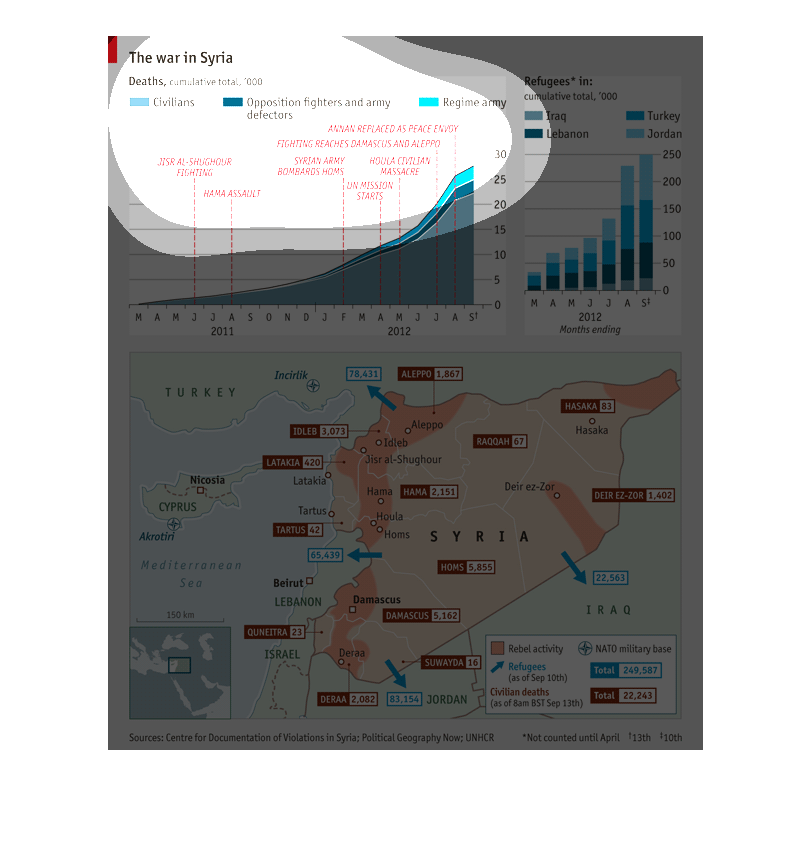
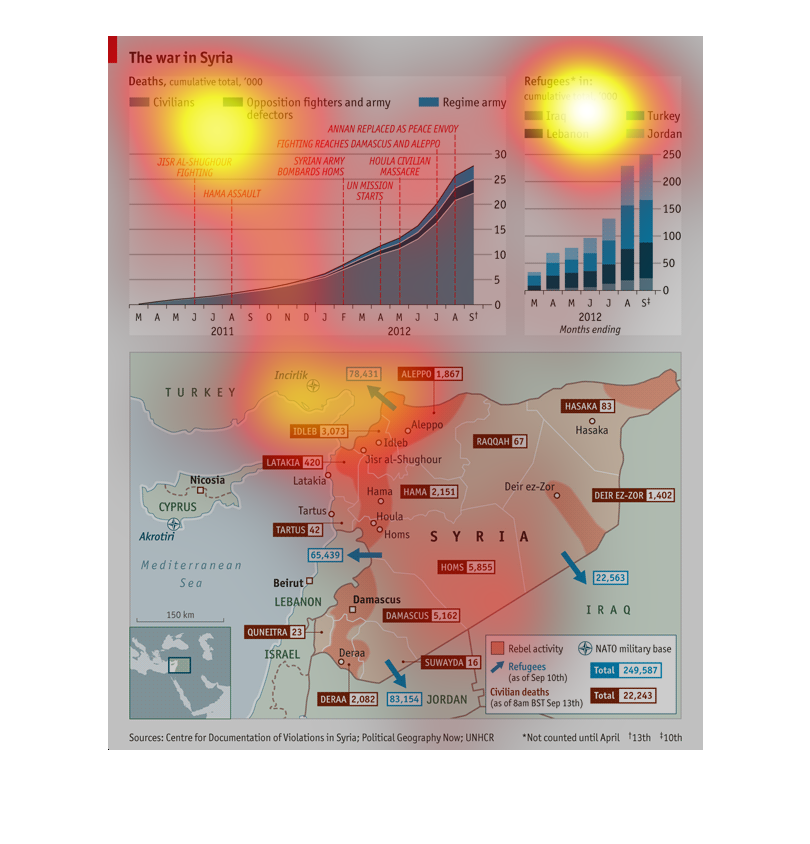
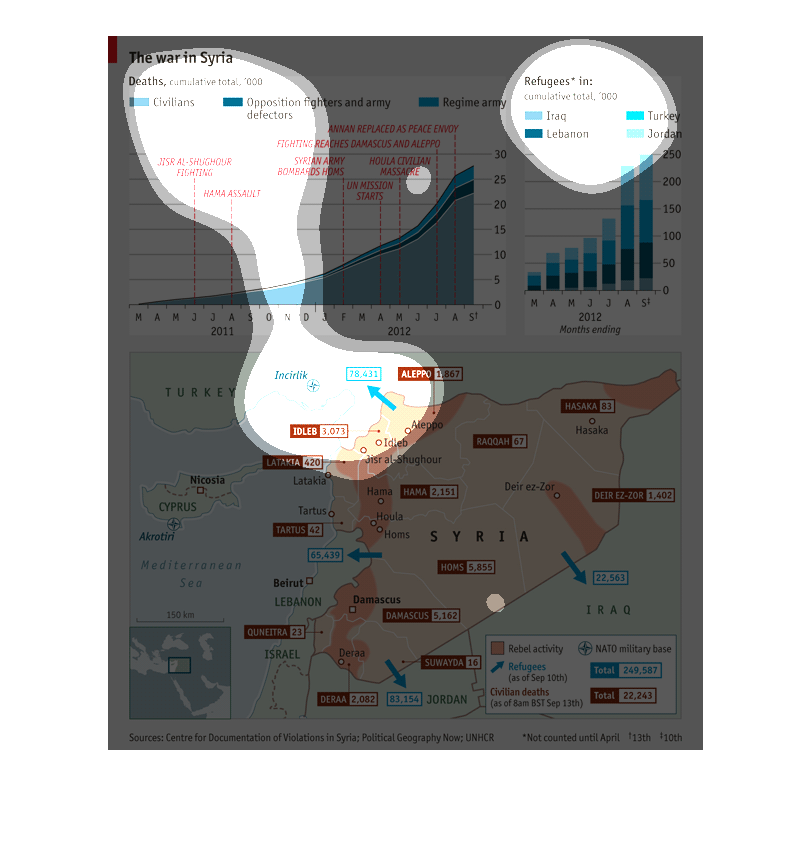
Three graphs give information about the war in Syria. The upper left graph shows the deaths
of civilians, regime army, and opposition fighters over time. The graph trends upwards and
jumps with important events, which are also marked on the graph. The upper right graph shows
refugee populations in Iraq, Lebanon, Turkey and Jordan over the course of 2012. As time progresses,
the number of refugees increases. This graph shows a similar trend to the one detailing the
deaths, in the upper left. The bottom chart shows a map of Syria. Labeled on this map are
areas of rebel activity, movement of refugees, civilian deaths, and NATO military bases. The
map shows that as rebel activity increased and expanded, refugees moved out of rebel occupied
areas.
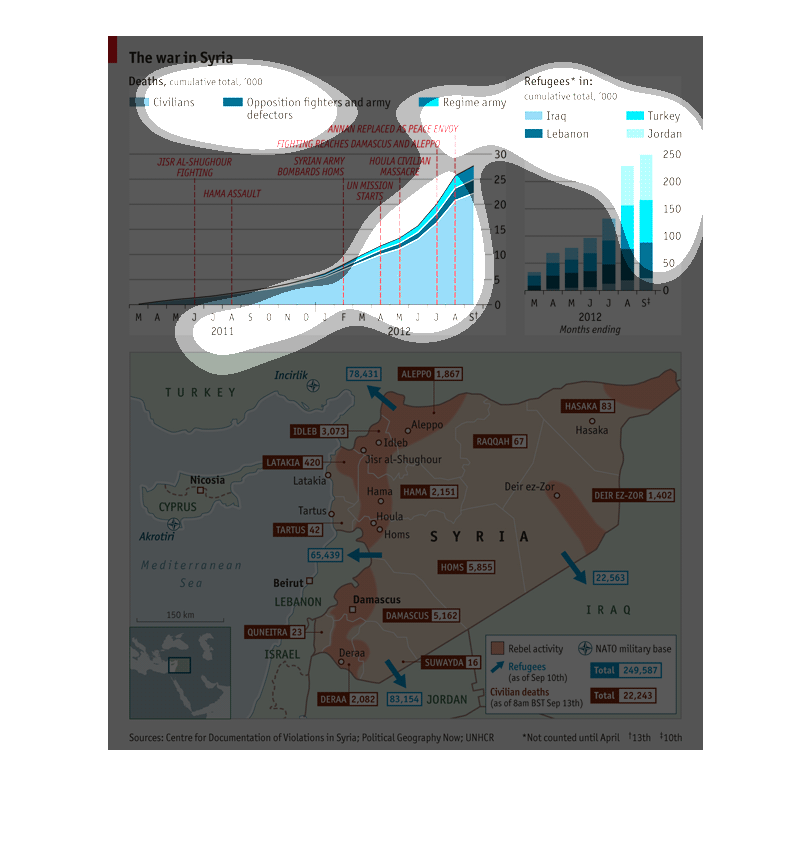
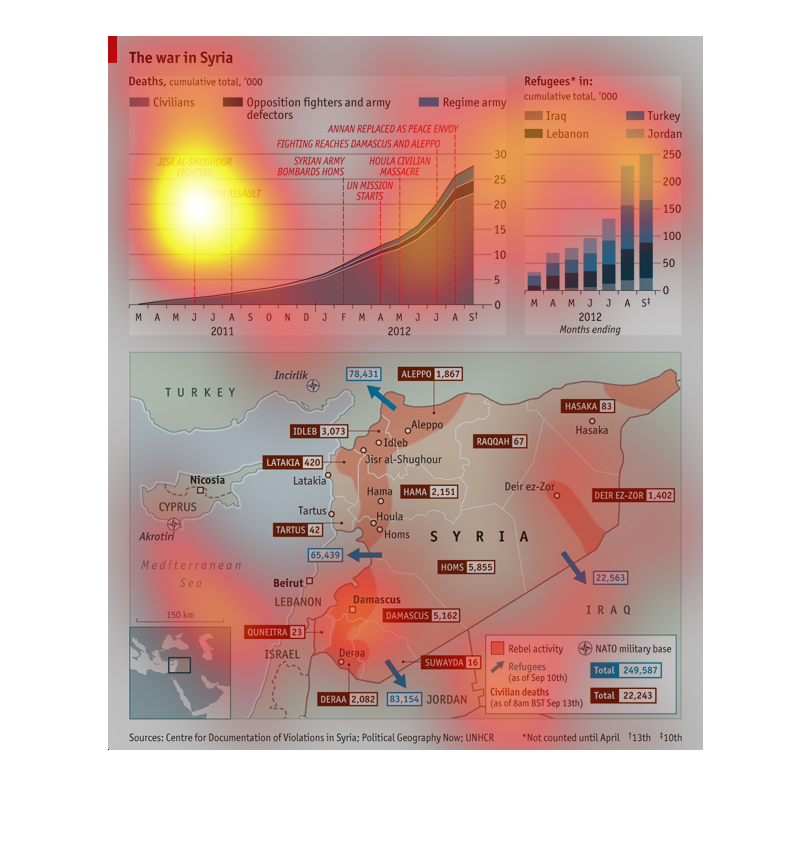
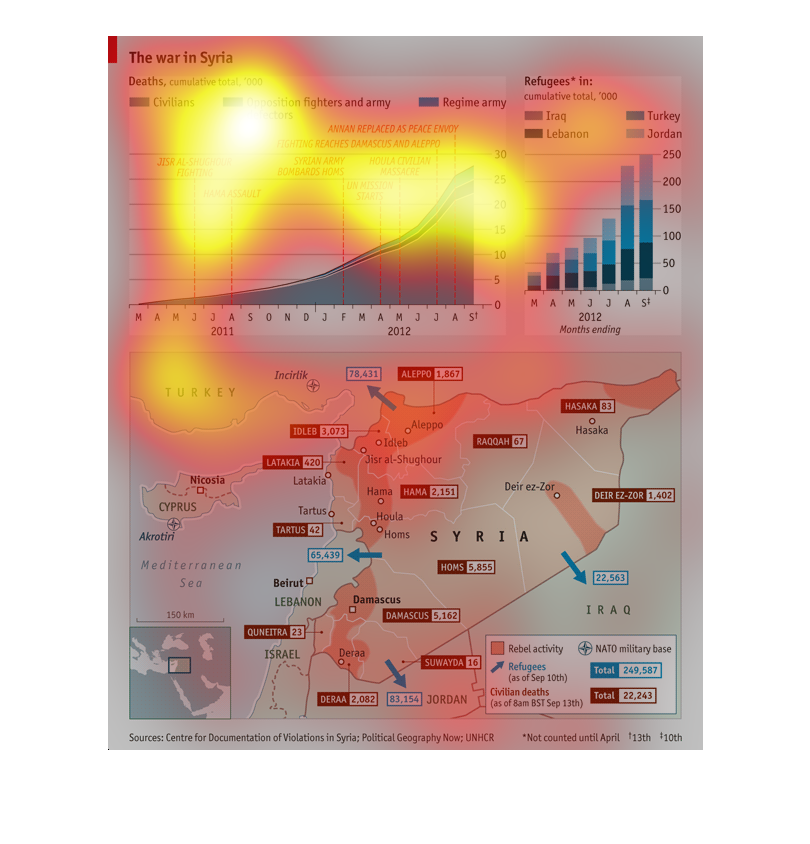
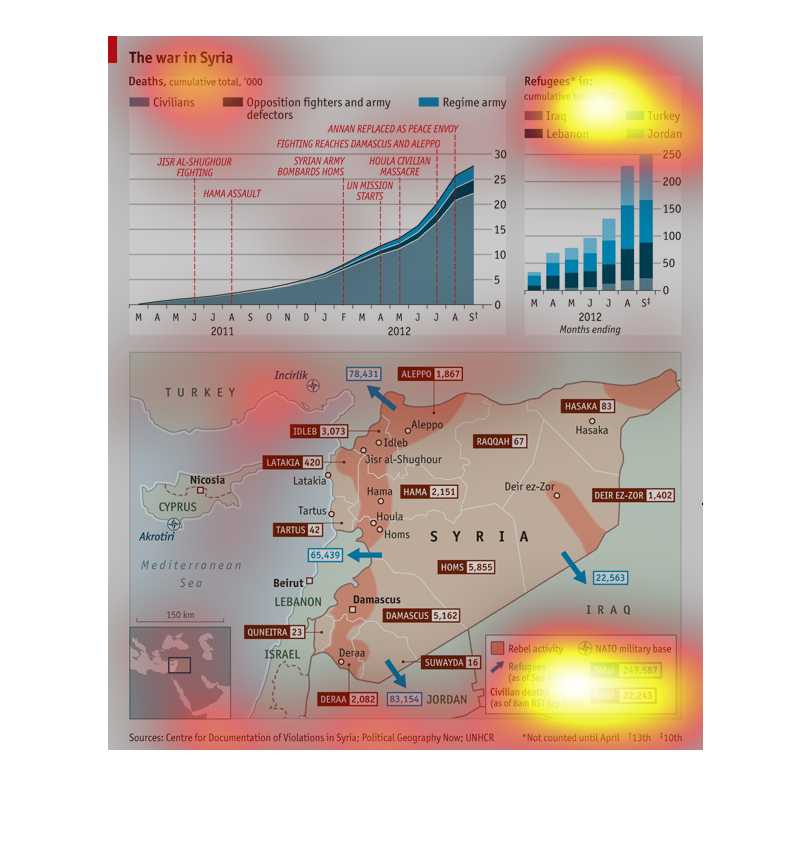
This infographic shows different details on the War in Syria – including the number of
deaths, and how many refugees are relocated in other countries. It also shows a map of rebel
activity, war activity, and etc.
This chart presents the relationship between war in the middle east and the numerous refugees
displacements in the area. It presents and increasing chart detailing the number of refugees
as they relate to the many attacks of the Western coalition.
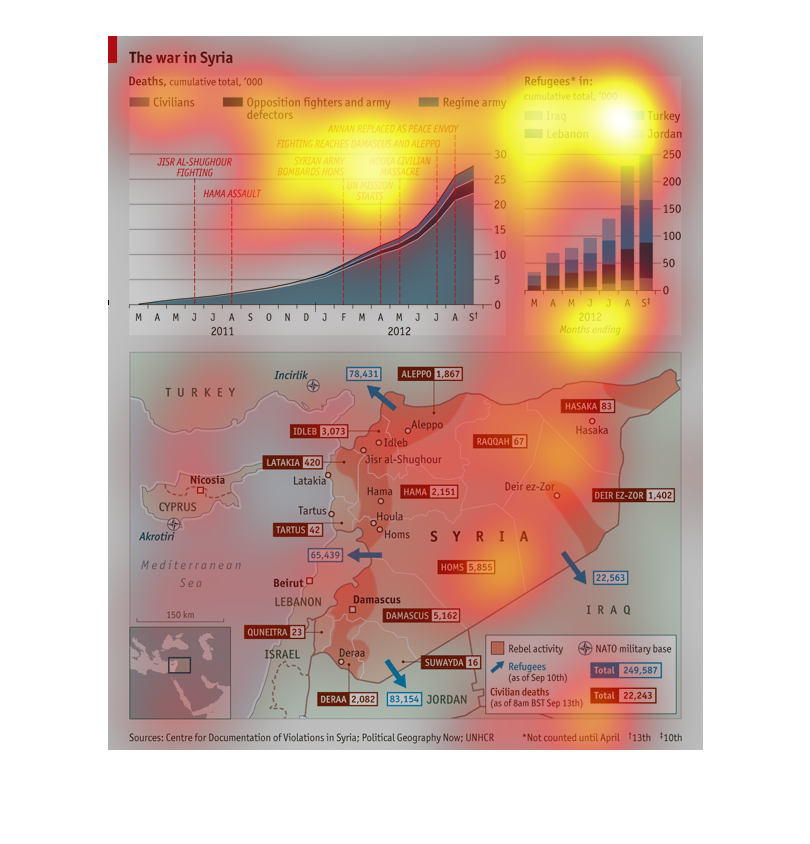
There are three graphs on this image. The right upper graph shows the number of Refugees in
Iraq, Lebanon, Turkey, and Jordan for the months in 2012. It is increasing with a somewhat
exponential trend. The upper left graph shows the deaths of civilians, fighters and defectors,
and regime army persons. This is also steadily increasing, with specific events marked on
the graph. The final bottom image is a map of Syria with locations of rebel activity and refugees
marked.
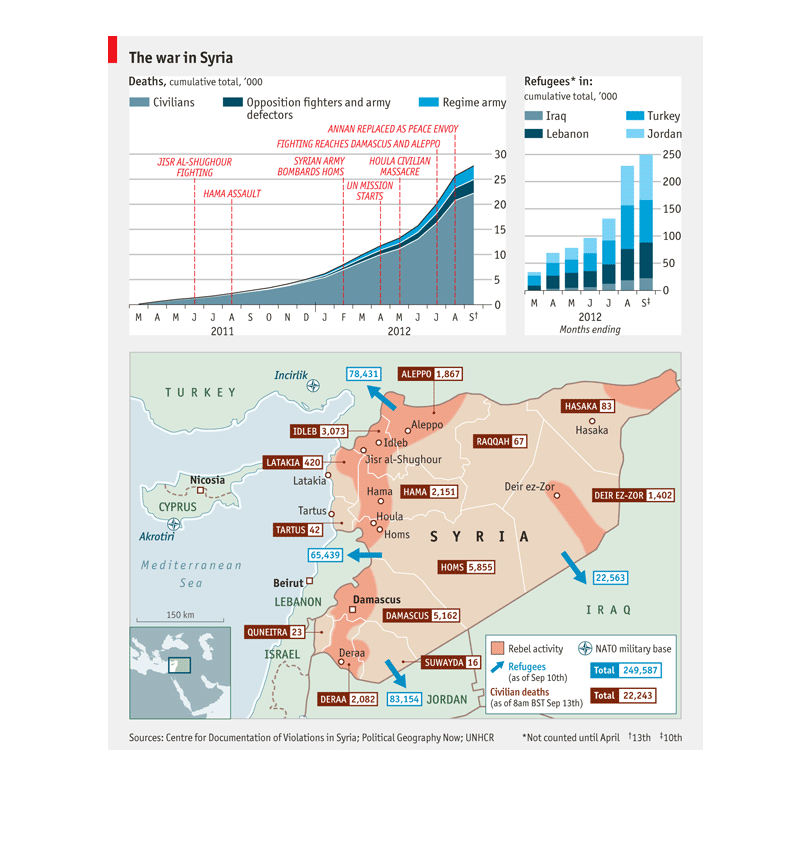
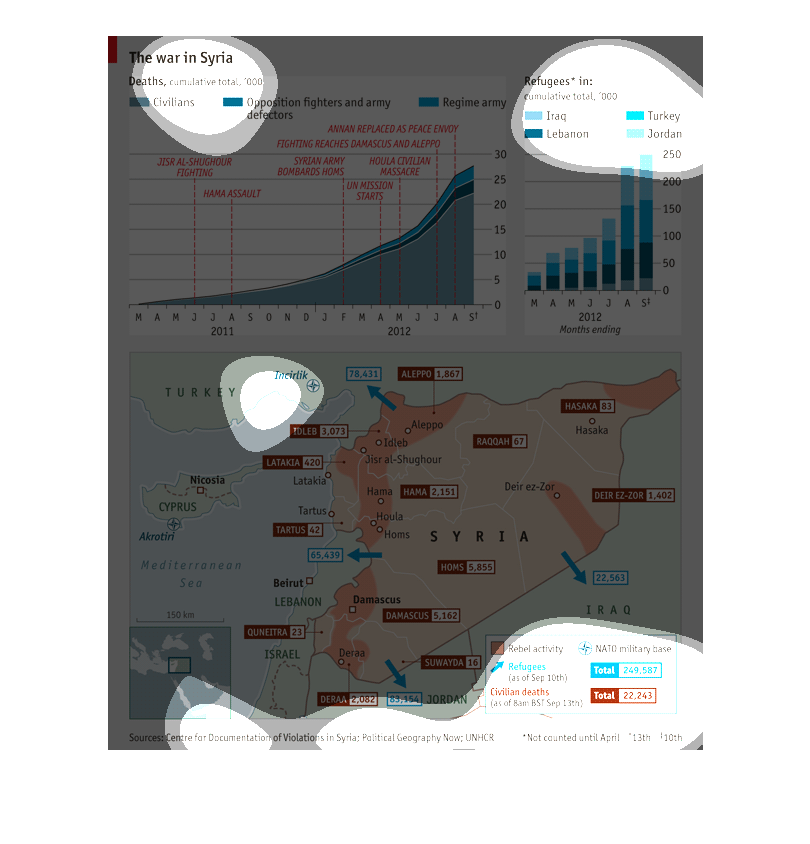
These sets of charts and graphs have to deal with the syrian war. It shows which countrys
have taken in refugees. It also states key battles and movent in a graph through out 2011
and 12.
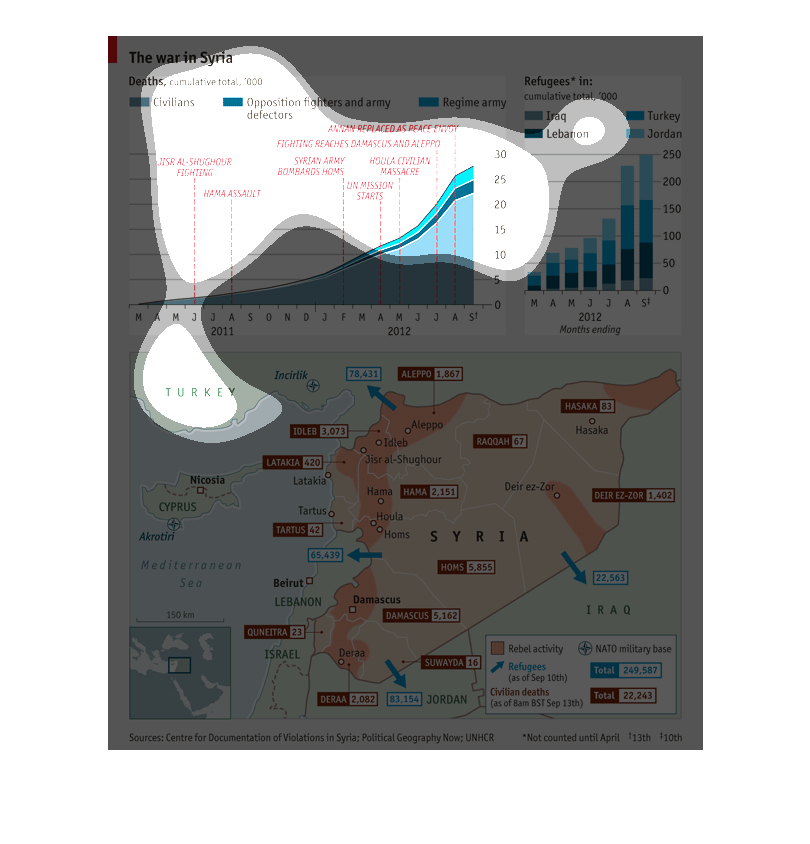
This is a graph about the war in Syria- measuring deaths of civilians, rebels, and regime
army personnel, and measuring numbers of refugees from Iraq, Lebanon, Turkey, and Jordan.
Also, measuring how increased rebel activity impacted the number of refugees.
This is a chart showing the cumulative totals of deaths in the war in Syria. It also shows
where the refugees have fled to. There is a map of the region showing rebel activity and refugees.
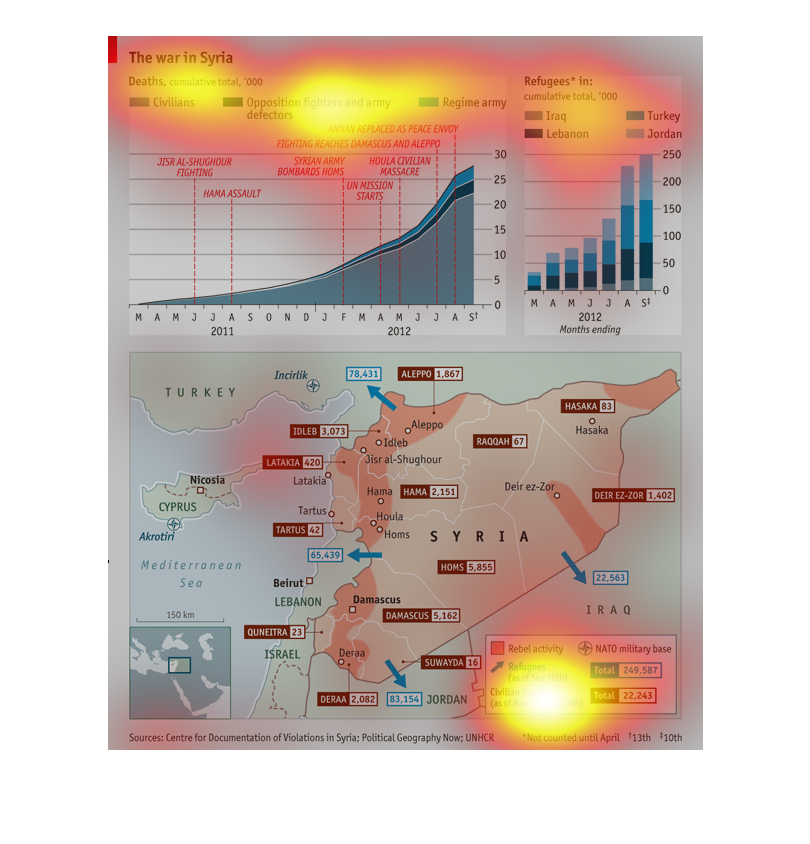
This graph illustrates the increasing violence and disorder of the Syrian people between 2011-2012,
and how things steadily escalated, disorder and violence abound.
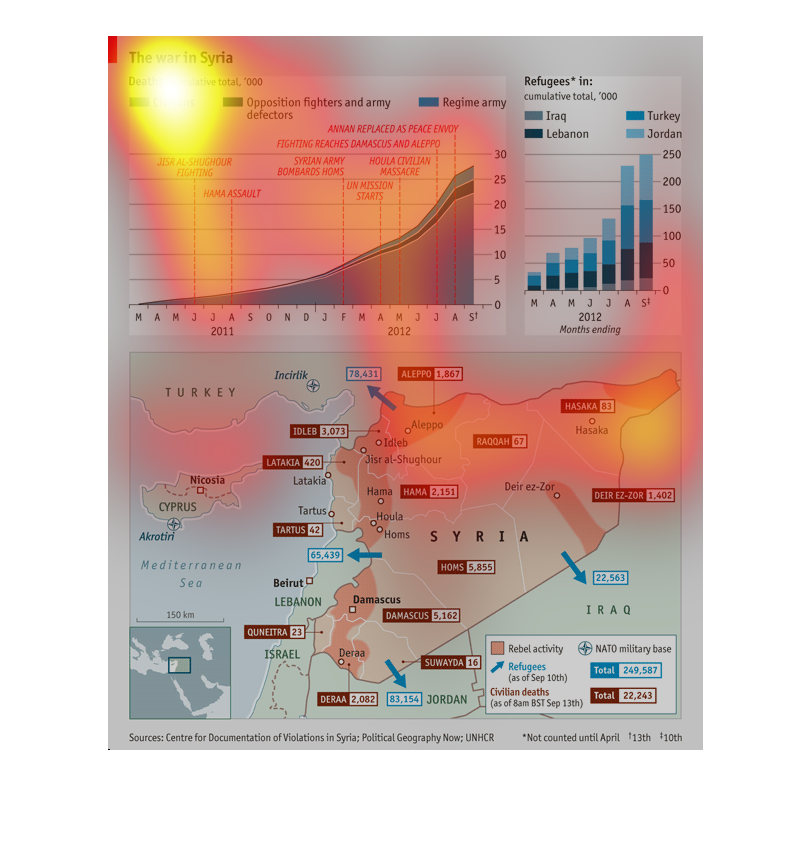
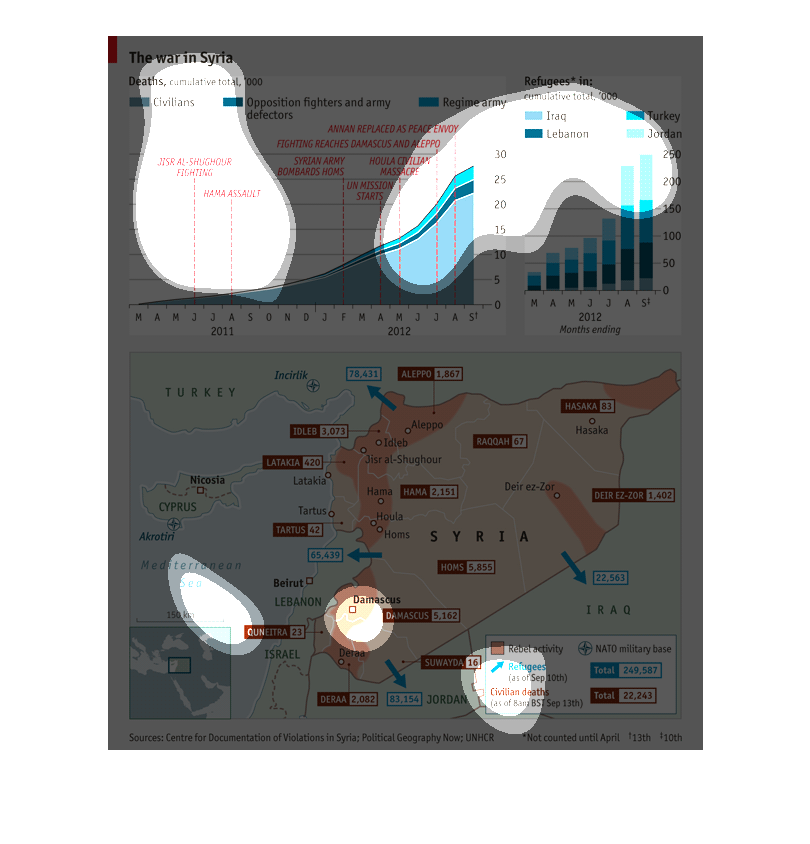
This chart describes the war in Syria. Specifically the cumulative total of deaths. Categories
include civilians, opposition fighters and army defectors.
The first graph breaks down the number of deaths due to the Syrian war, dividing the deaths
by characterizing those who died. The second graph shows the number of refugees in 4 countries.
The bottom of the image shows a map of Syria.
This has several charts concerning the war in Syria. One chart shows civilian deaths versus
combatants. One chart shows which countries are housing the most Syrian refugees. One chart
has a map of the destinations of Syrian refugees and the refugee camp locations inside and
outside of Syria. Deaths from the war increased dramatically from 2011 to 2012, with civilians
making up the vast bulk of deaths. refugees from the war either stay in one of several camps
within Syria, or typically flee to Turkey, Jordan or Lebanon.