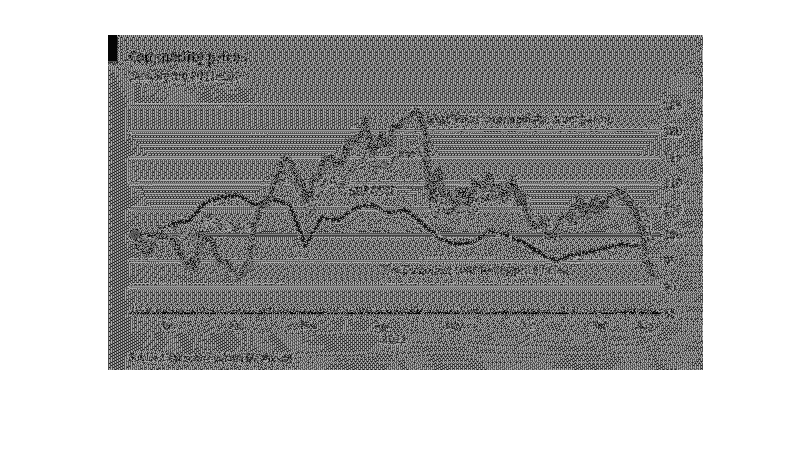
This graph is a look at the fluctuation in commodity prices in the first part of the year
2011. The graph indicates a peak in commodity prices around April of 2011, with a steady decrease
overall since.
Error using .*
Matrix dimensions must agree.

Error in plotSpotlight (line 30)
    output = repmat(a,[1 1 3]).*single(im)/255;

Error in plot_individual_user_maps (line 49)
        [heat] = plotSpotlight(im,heatmap,3);