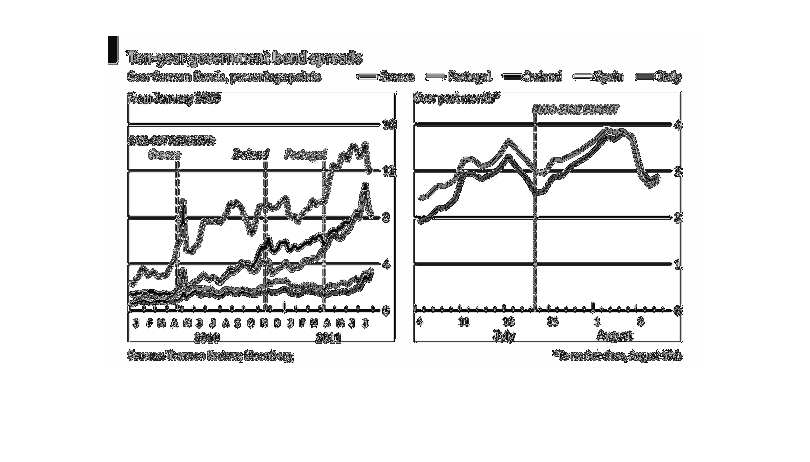
This chart depicts the 10-year relationship of government bond spreads over German Bonds percentage
points between the months of July and August in the years 2010-2011 among nations of the Mediterranean
in Europe.
Error using .*
Matrix dimensions must agree.

Error in plotSpotlight (line 30)
    output = repmat(a,[1 1 3]).*single(im)/255;

Error in plot_individual_user_maps (line 49)
        [heat] = plotSpotlight(im,heatmap,3);