The chart displays China's population growth since the one-child policy was introduced. It
shows what the UN predicted level would be had it not been implemented. It shows since the
restrictions became stricter. The policy is effective.

This line graph shows China's population from the years 1950 to a projected forecast of 2100.
 It has one scenario for uncontrolled and one for strict enforcement of the one child policy.
The graph shows the previous level and the predicted forecast for China's population since
adopting the "one child law" back in the late 1970s. The forecast extends out to the year
2100.
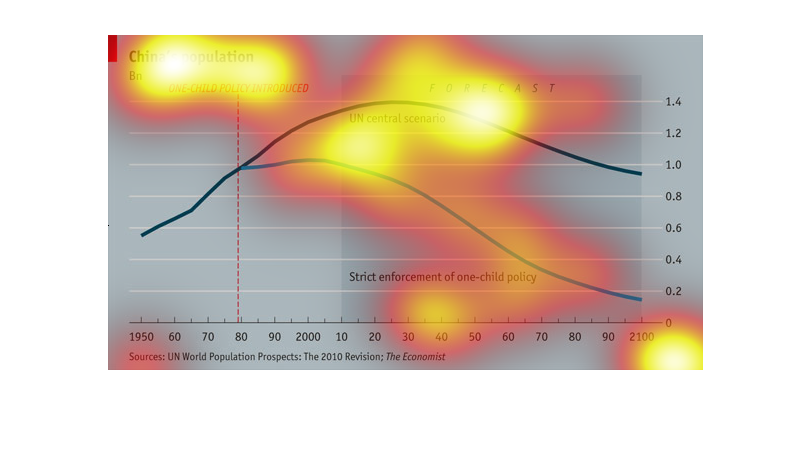
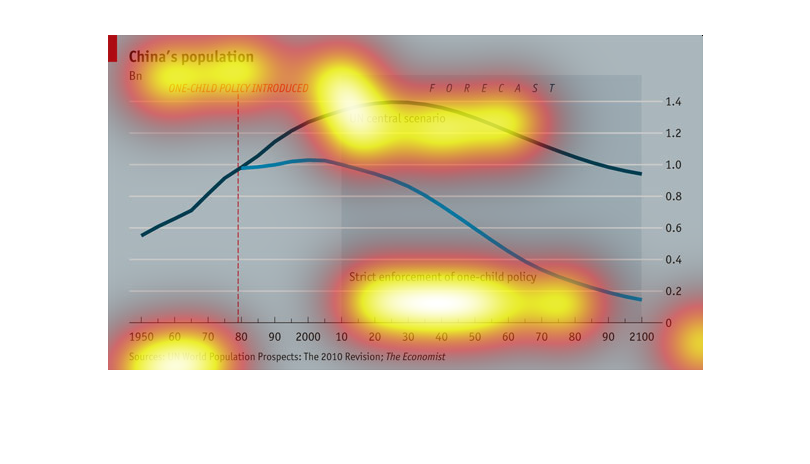
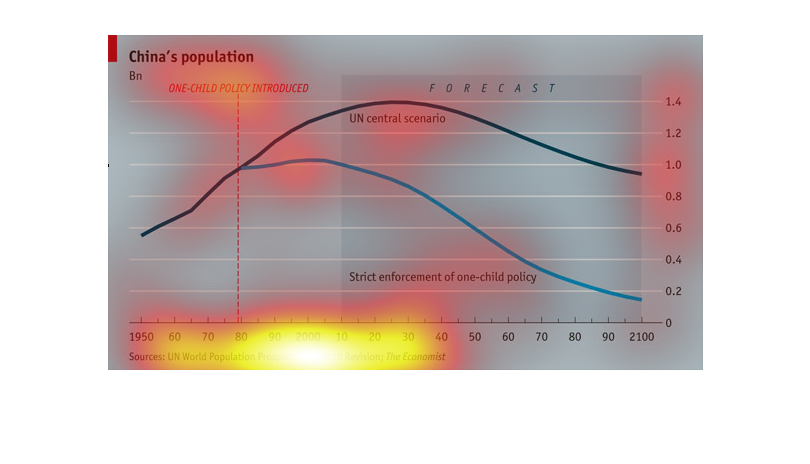
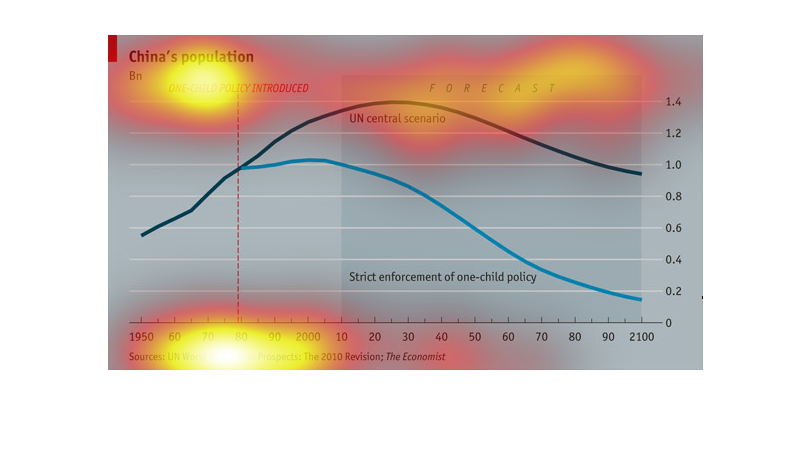
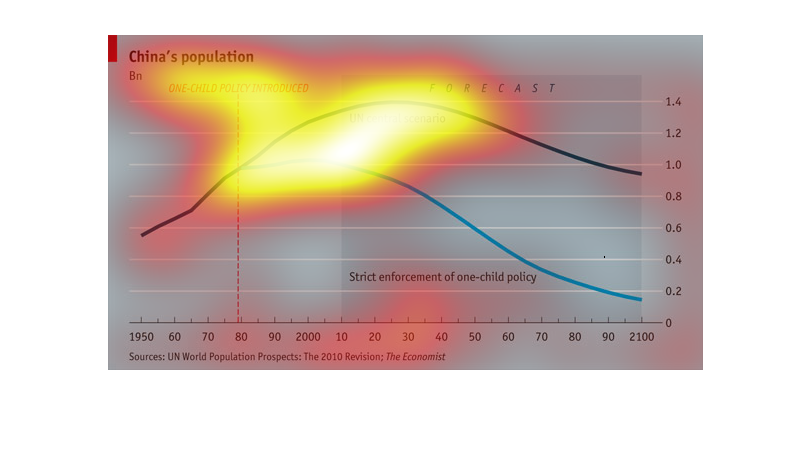
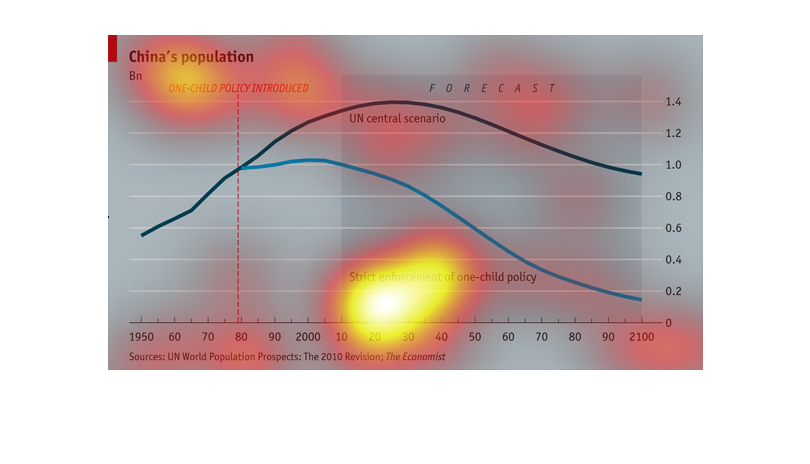
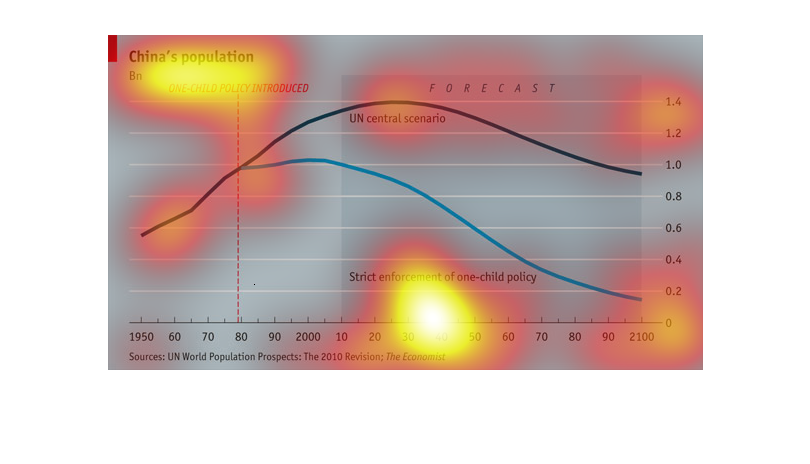
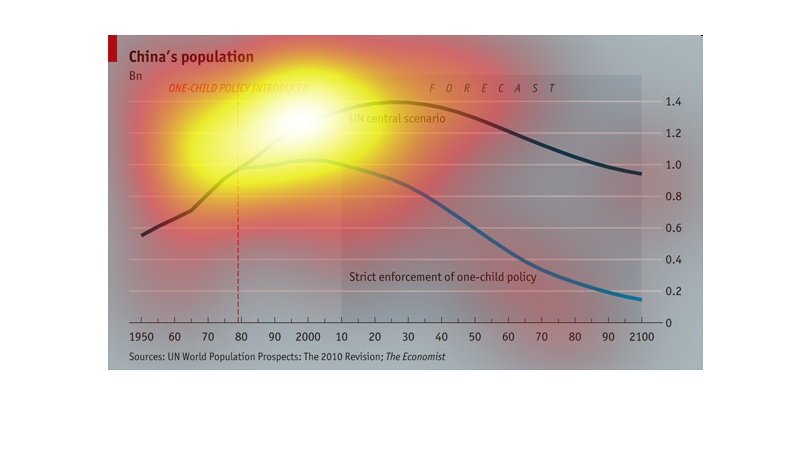
The graph is a comparison of China's population under the one-child policy vs. the UN central
scenario, which diverged in 1980. The graph, which goes from 1950 to 2100, shows China's population
peaking at 1.4 billion in 2050 under the UN scenario, and peaking at 1 billion in 2000 under
the one-child policy. The data is from the The Economist's article, UN World Population Prosects:
The 2010 Revision.
The graph is about Chin's population and the one child policy. It begins in 1950 and ends
in 2100. I must predict the population in the future. it must have the amount of children
because it does not say population equals on the left side.
China's population with forecast. One child policy introduced. UN central scenario. Sources
UN World Population Prospects 2010 revision The economist.
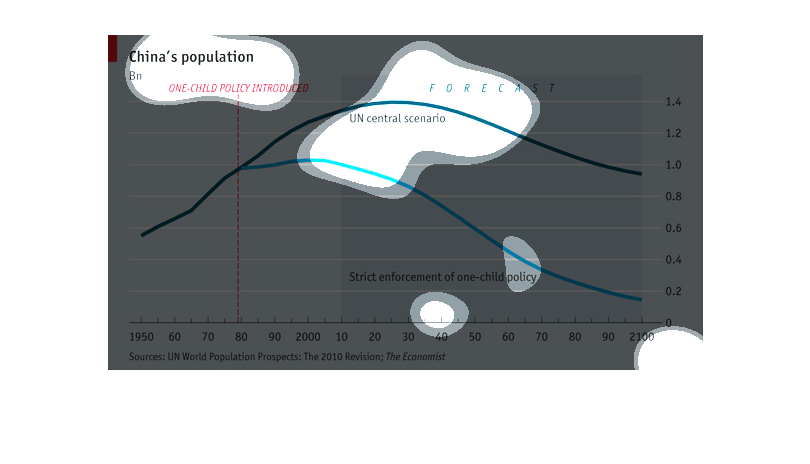
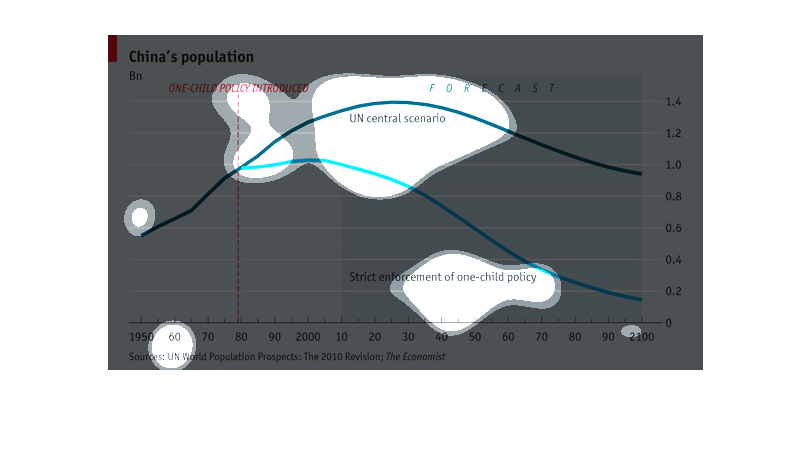
This graph shows two lines representing China's population after a one-child policy has been
implemented. The light line shows ideal enforcement and the dark blue line shows UN estimates.
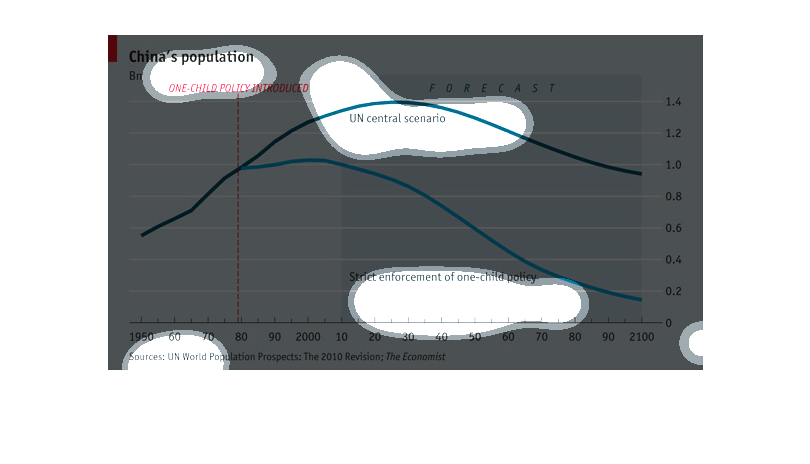
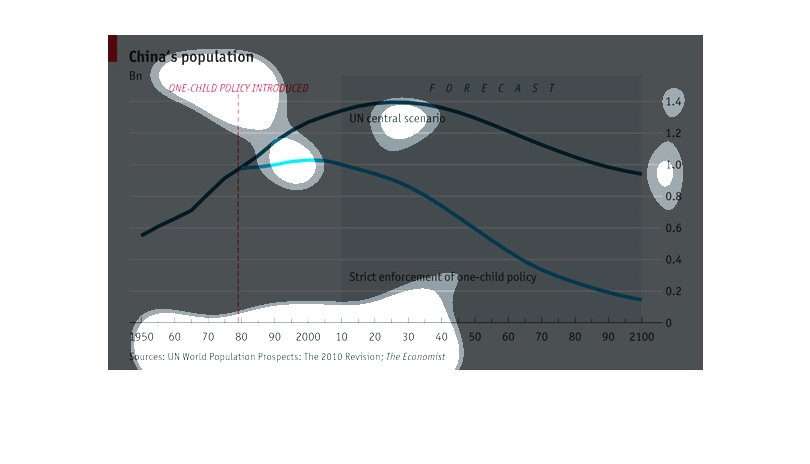
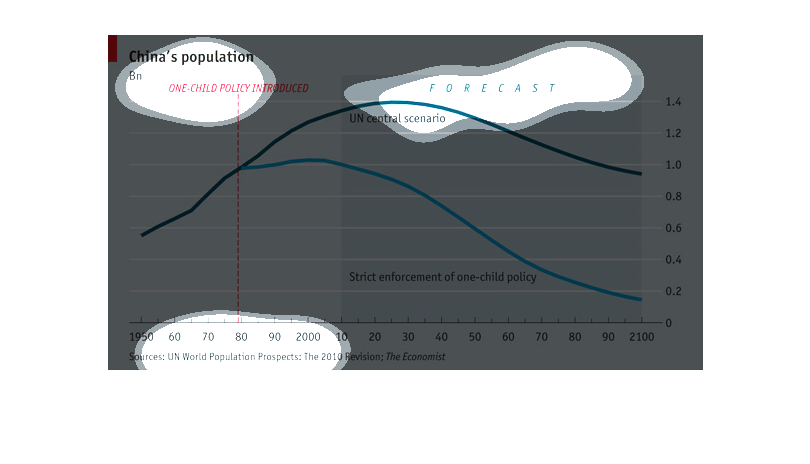
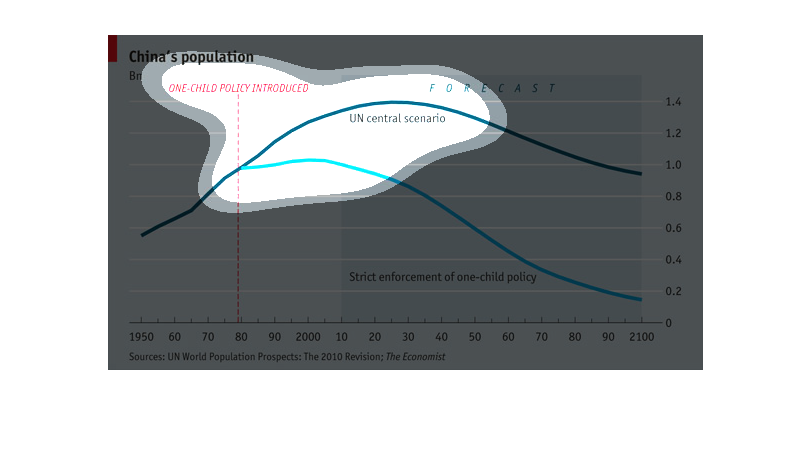
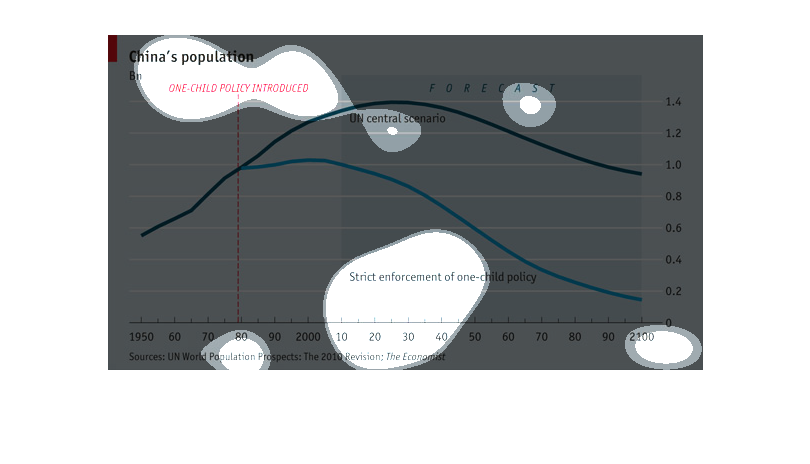
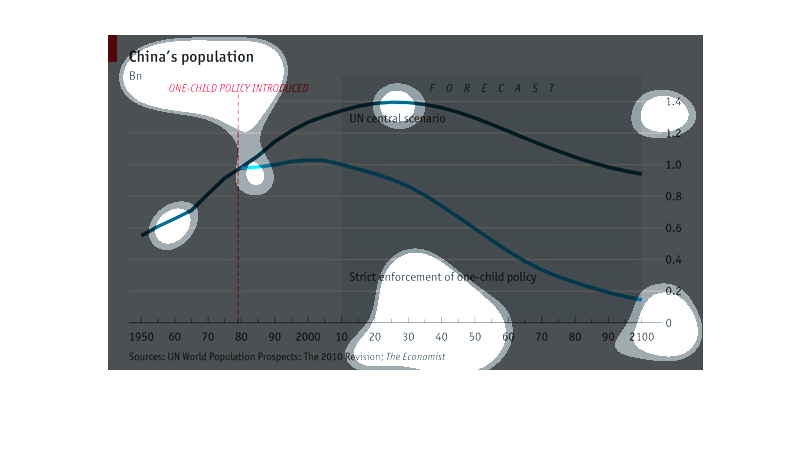
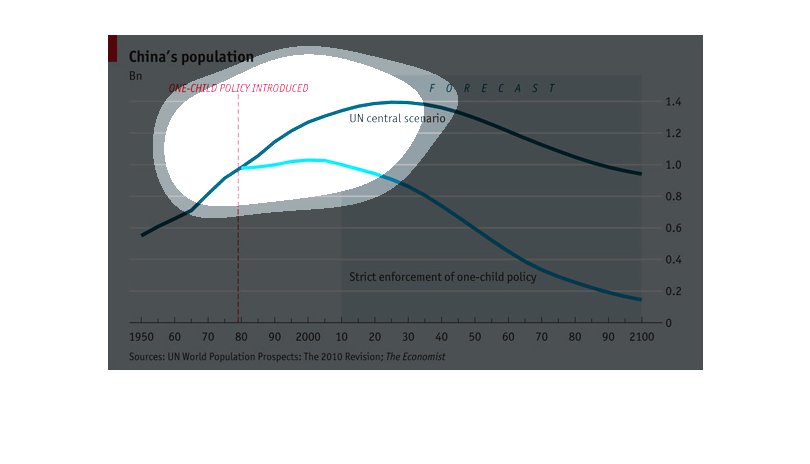
The chart shows the population on China from the 1950s until 2100, with projected numbers
for future dates. The chart demonstrates possible scenarios depending on the strictness with
which the one child policy (introduced in 1979) is enforced. If strictly enforced, the population
is projected to have peaked around the year 2000 with a substantial dropoff from that point.
According to UN Central predictions, however, China's population will peak around 2030 with
a slower dropoff after that point.
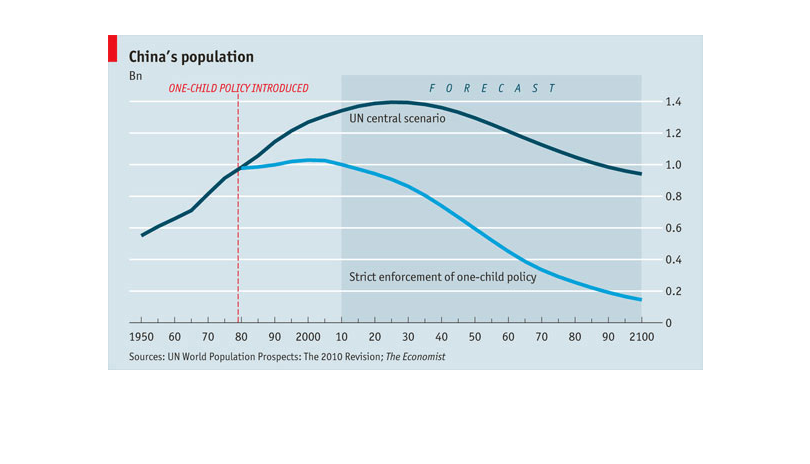
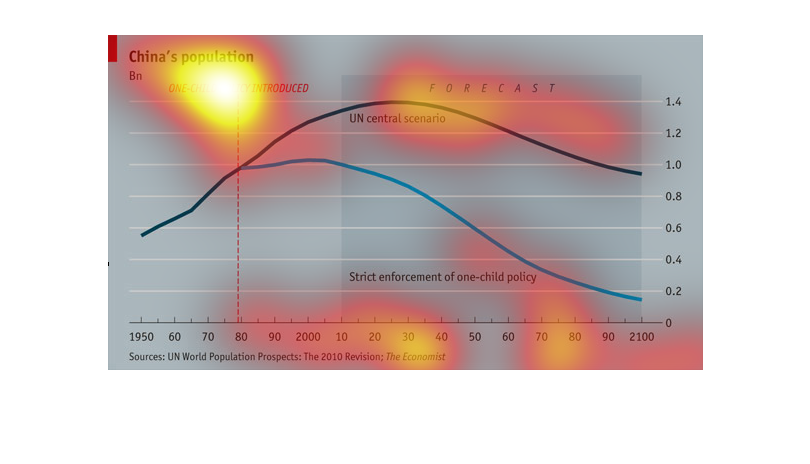
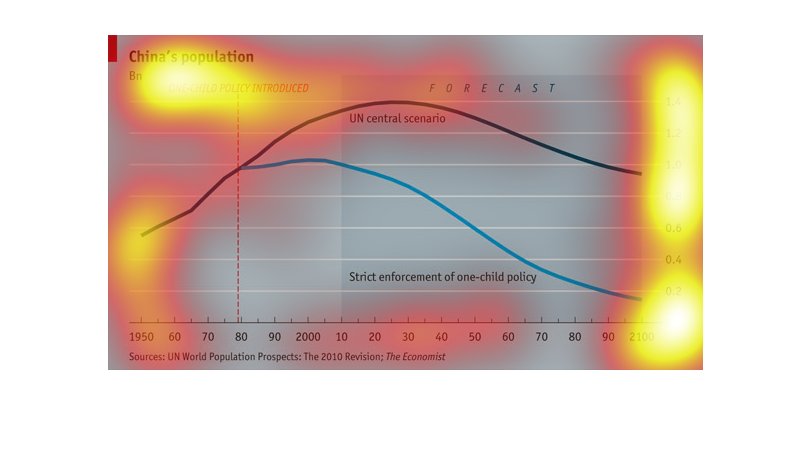
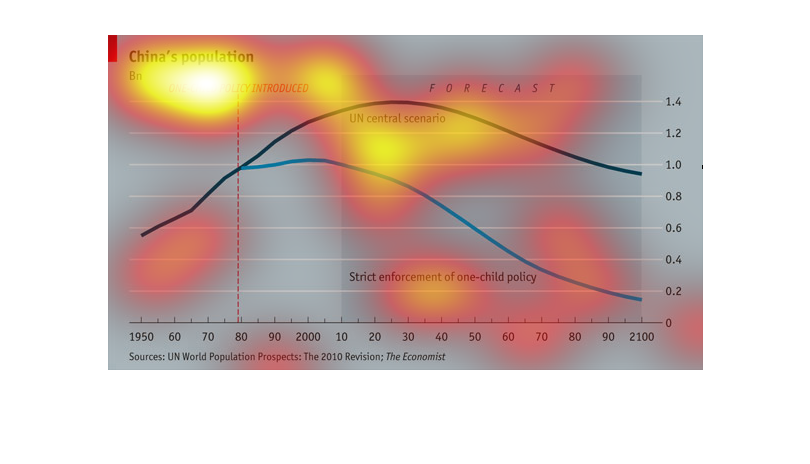
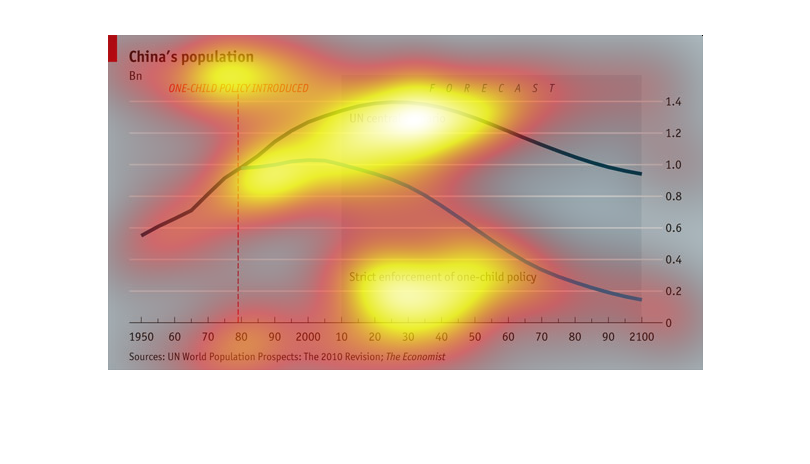
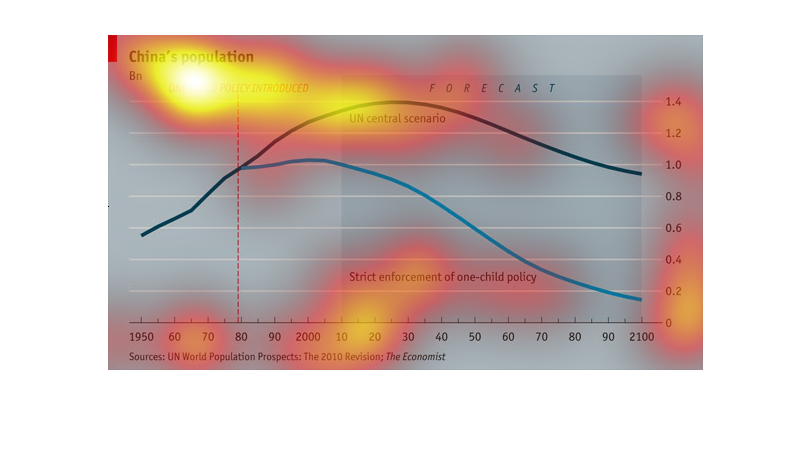
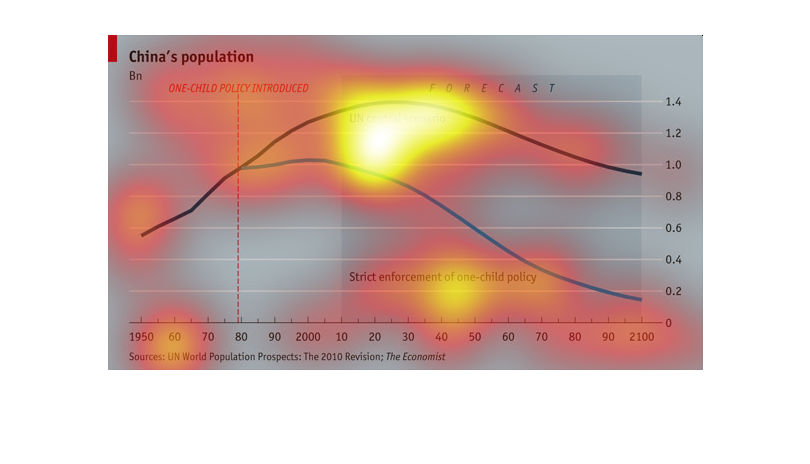
The study shows two scenarios for the projection of the population in China.  The line graph
splits in two following the introduction of the one child policy in 1980.  One line follows
the U.N. projection of population peaking in 2030 with a gradual decline.  The second line
shows a projection of population with a strict implementation of the child policy.  This graph
peaks around 2005 before falling into a more pronounced decline.
This Chart describes China's population after the one child policy was introduced in 1979
and when it became strictly enforced in 2010 and the effects of the population until 2100.
The population drastically slowed, but it wasn't until strict enforcement that we started
seeing a decline.
This graph is about China's population and how introducing the one-child policy affected the
population growth over the years.  It shows the projection of population growth into the future
as well and how a stricter enforcement of the one-child policy will affect population size.
This chart shows the rate of China's population growth from 1950, projected through 2100.
 Within this 150-year period, the introduction of the "One Child Policy" shows a temporary
growth, followed by sharp decline over the last 70 years of the forecast.  The data was sourced
from "The Economist"
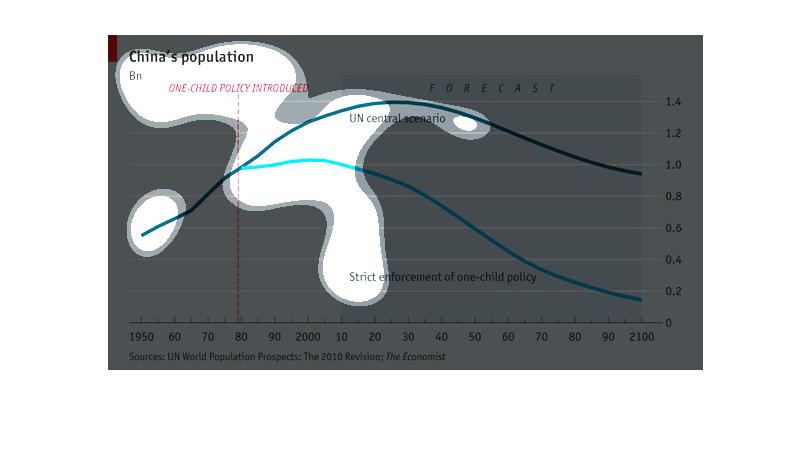
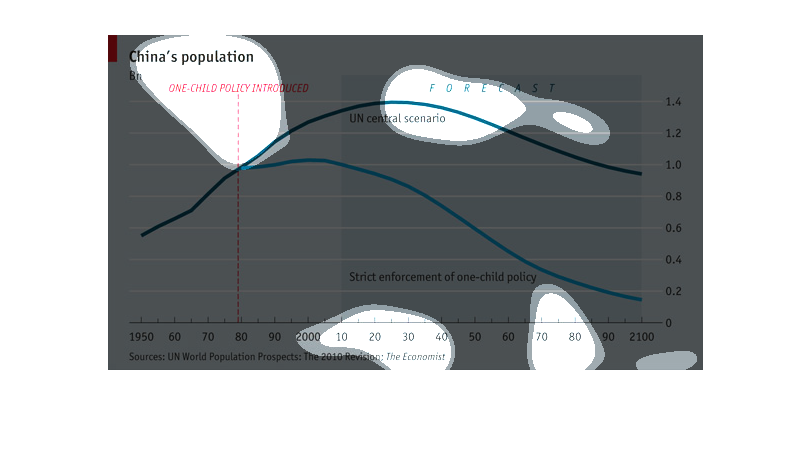
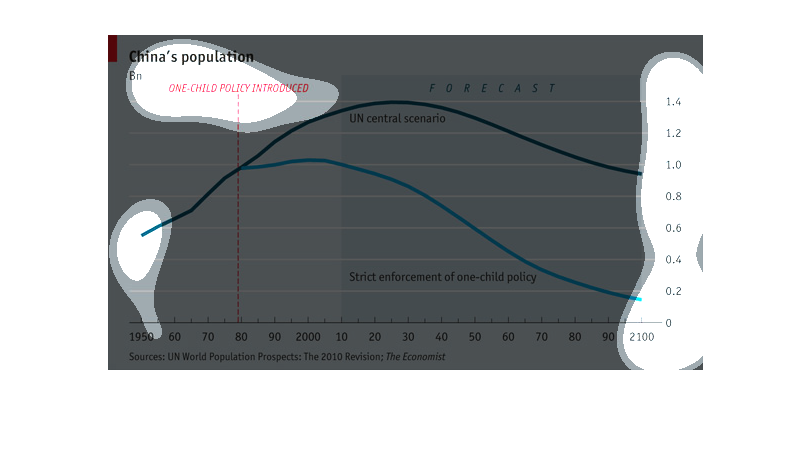
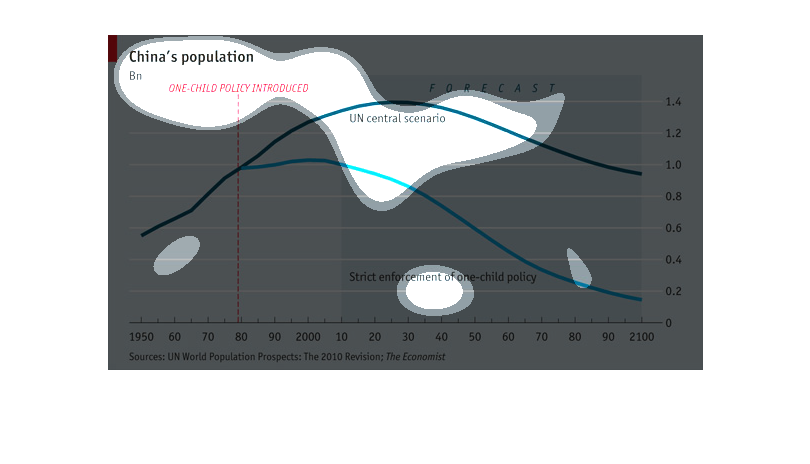
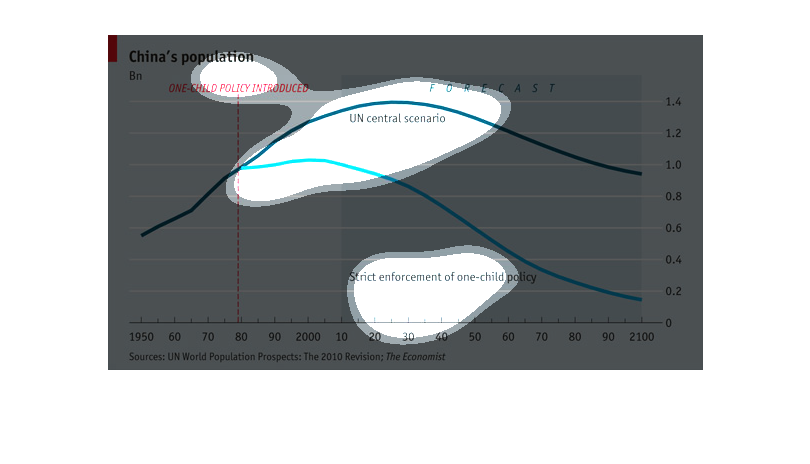
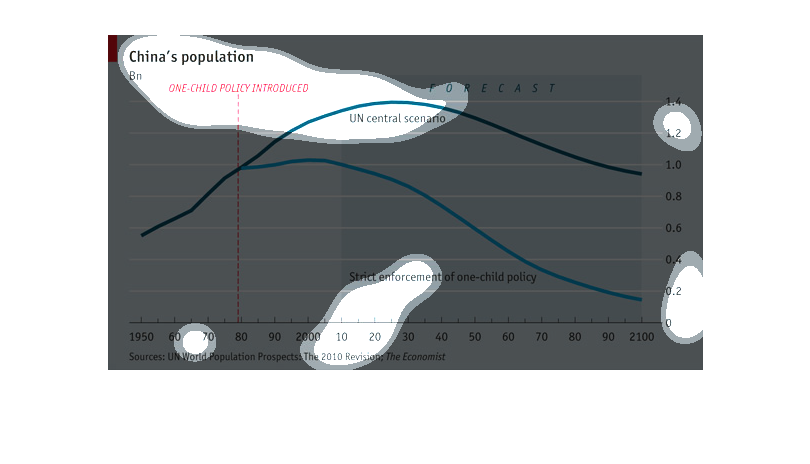
This is a graph depicting the population of China from the 1950's through 2100. The graph
shows how the population diverges following two different models, The UN Central Scenario
and the Strict enforcement of the One Child Policy.
This image is about China's population and how it decreased after having it's one child policy
in place. This is really interesting. I thought that the policy was put in place after that
year.
This is a chart depicting China's population from the years 1950 and forecast to 2100 and
separated into groups depicting the difference between continued enforcement of the one child
rule in the country.