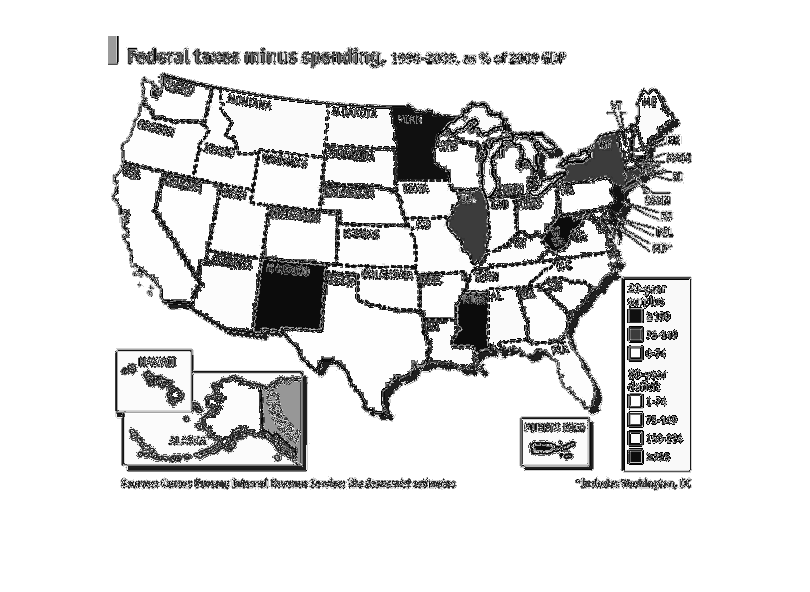
This chart displays the federal taxes minus spending between the years 1990 and 2009 as percentages
of 2009 GDP. The chart is a picture of the united states with each state a certain color,
red or green, to represent the percentage.
Error using .*
Matrix dimensions must agree.

Error in plotSpotlight (line 30)
    output = repmat(a,[1 1 3]).*single(im)/255;

Error in plot_individual_user_maps (line 49)
        [heat] = plotSpotlight(im,heatmap,3);