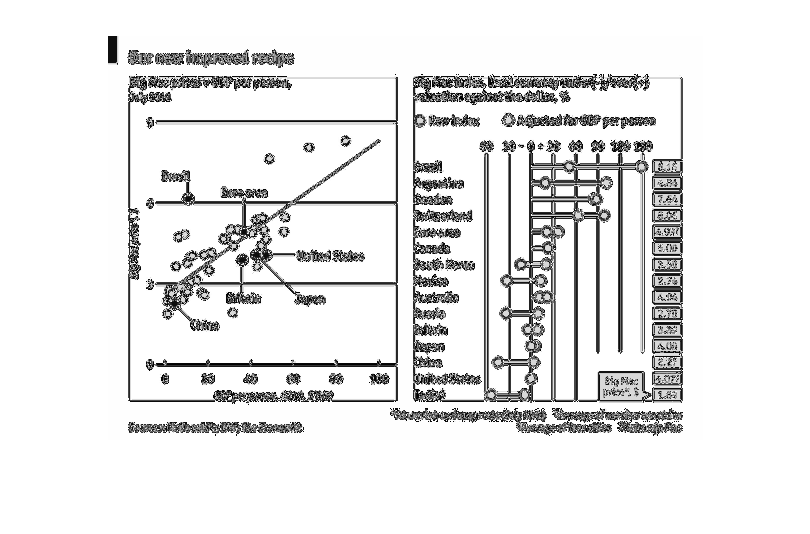
This shows the Big Mac prices vs. GDP per person in 2011 on the left. On the right we see
the "Big Mac Index" which maps local currency. I really have no idea what this is showing,
it's a mess.
Error using .*
Matrix dimensions must agree.

Error in plotSpotlight (line 30)
    output = repmat(a,[1 1 3]).*single(im)/255;

Error in plot_individual_user_maps (line 49)
        [heat] = plotSpotlight(im,heatmap,3);