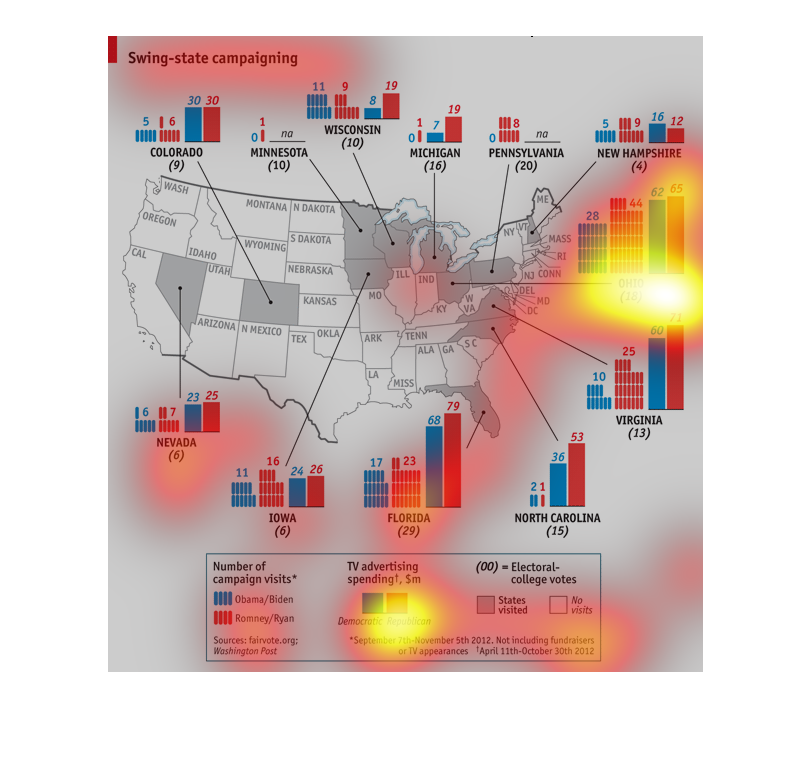
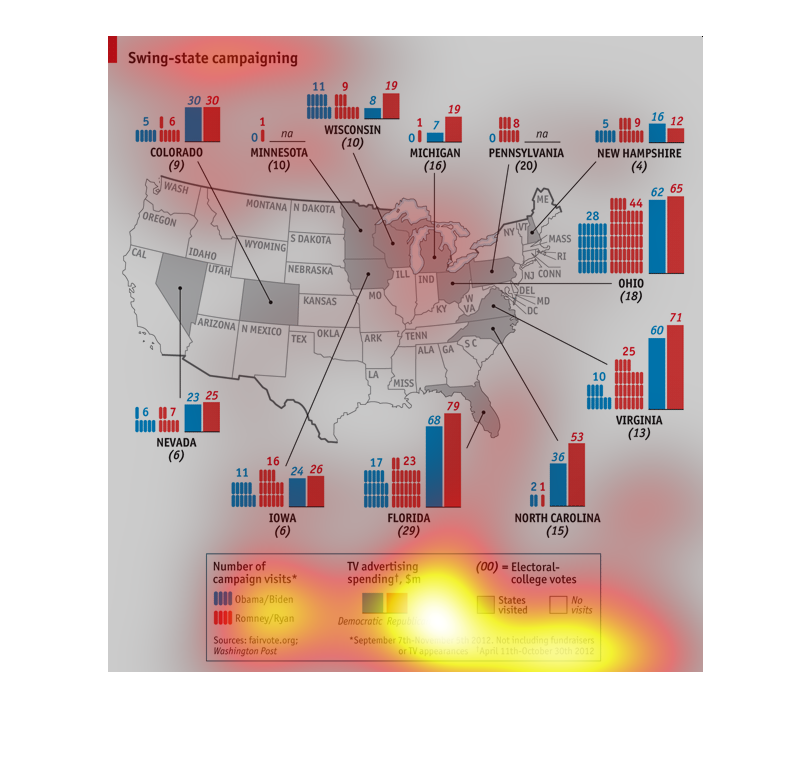
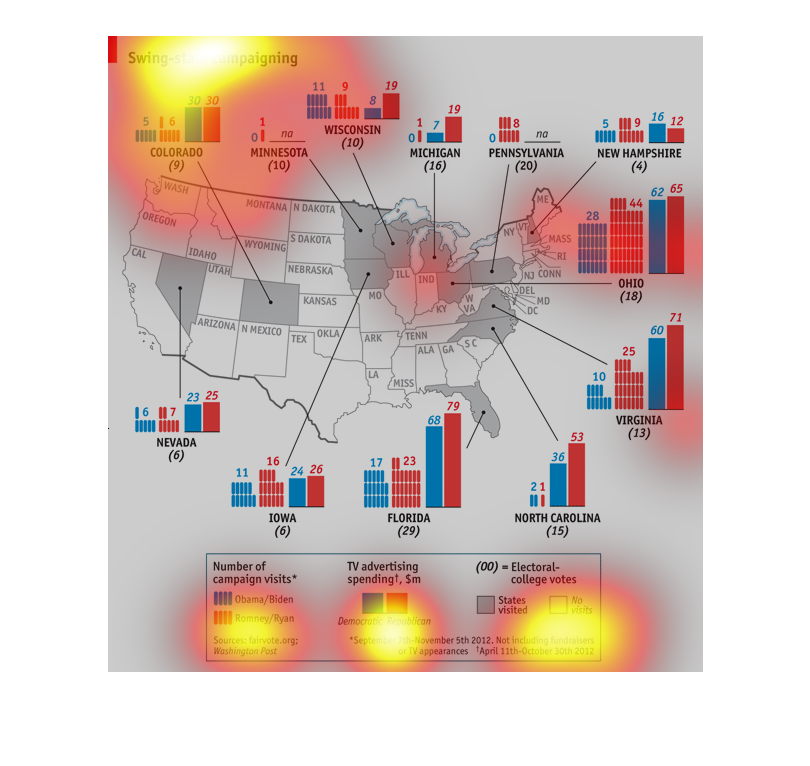
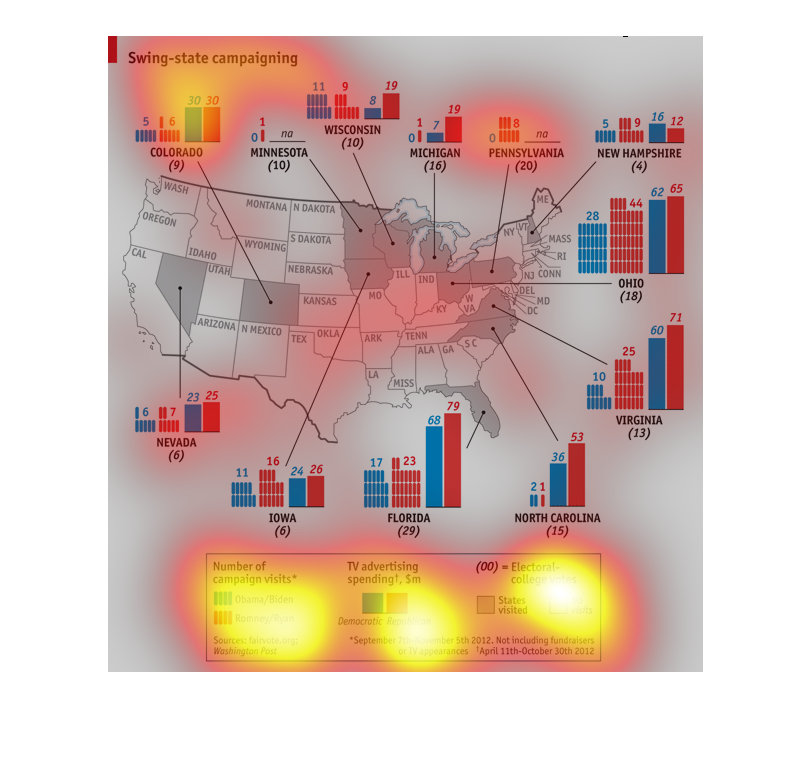
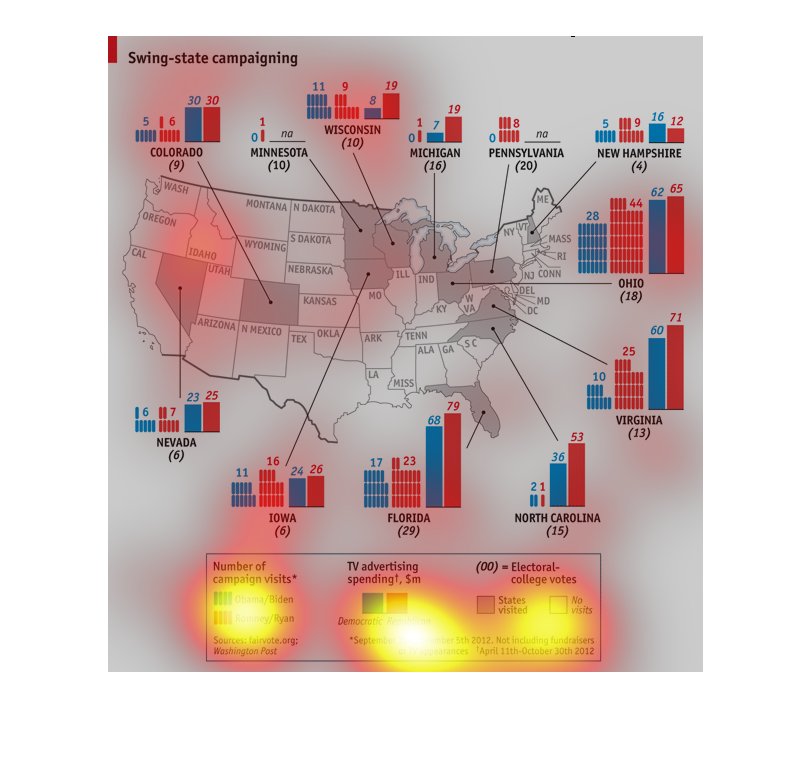
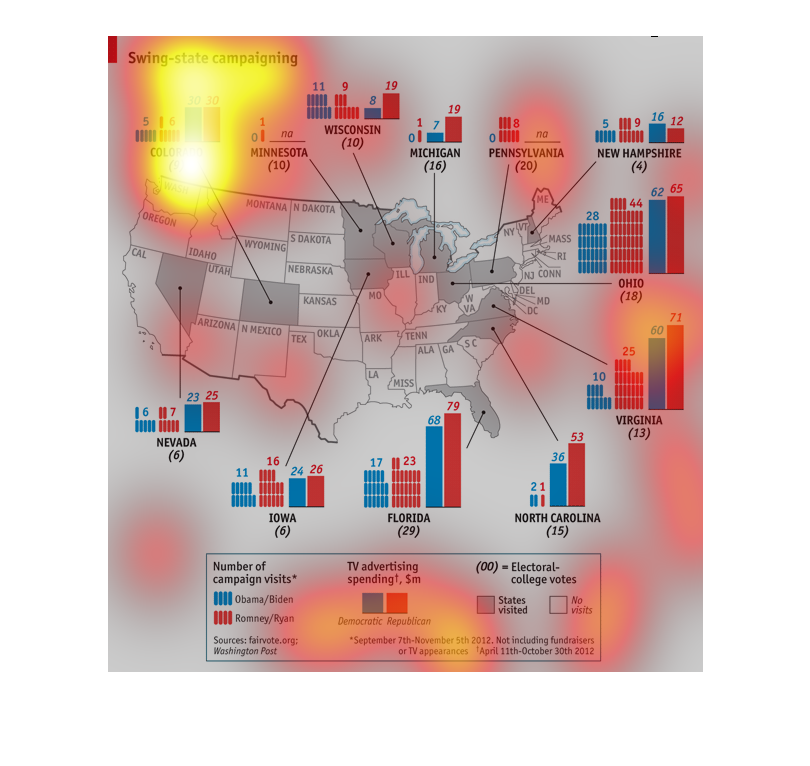
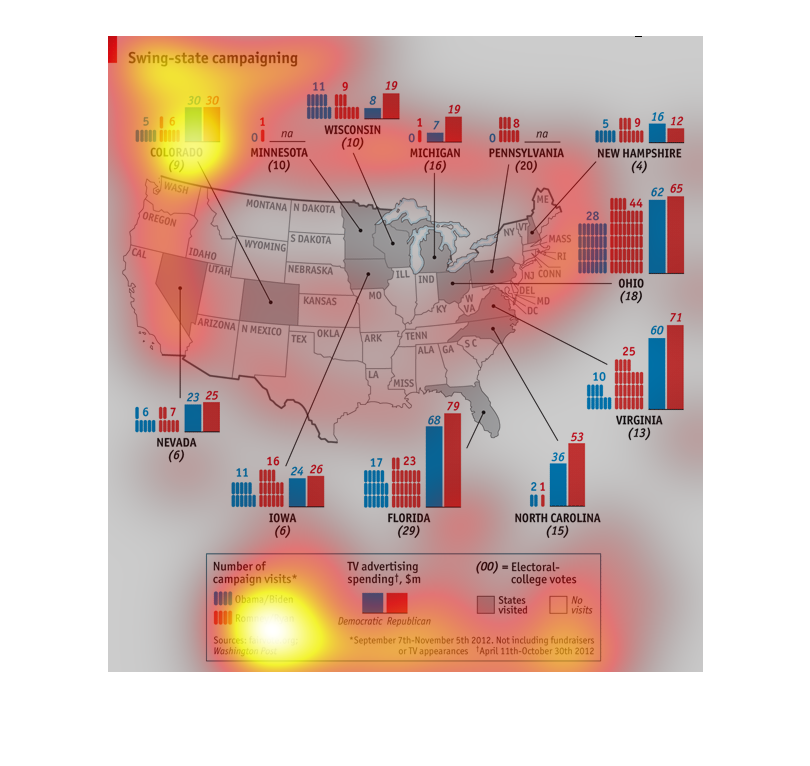
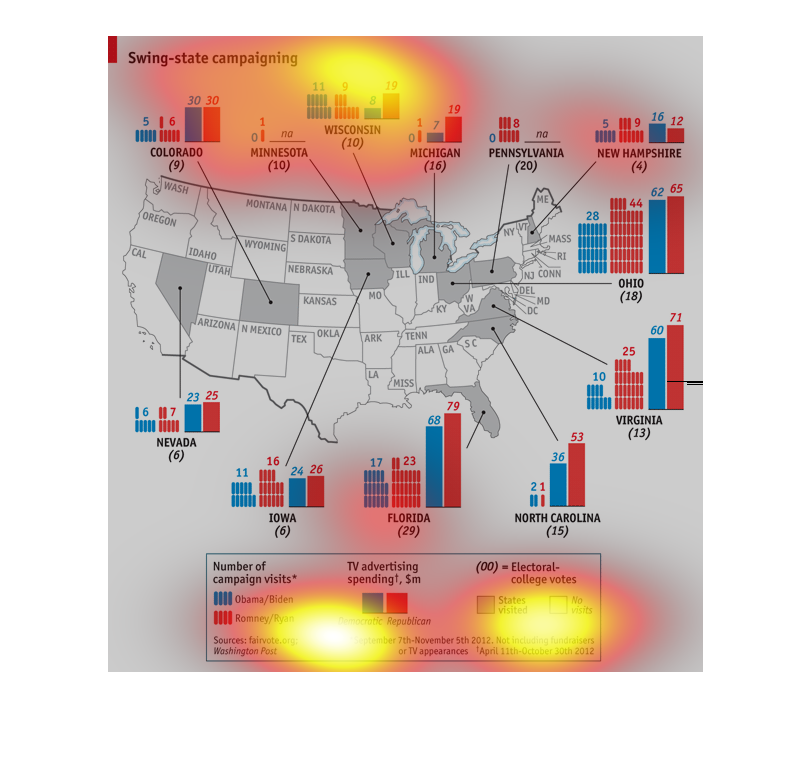
This graph depicts swing state campaigning in US states for the Obama Romney election.  IT
reflects things such as TV advertisement spending and number of campaign visits for each state
compared to electoral college votes.

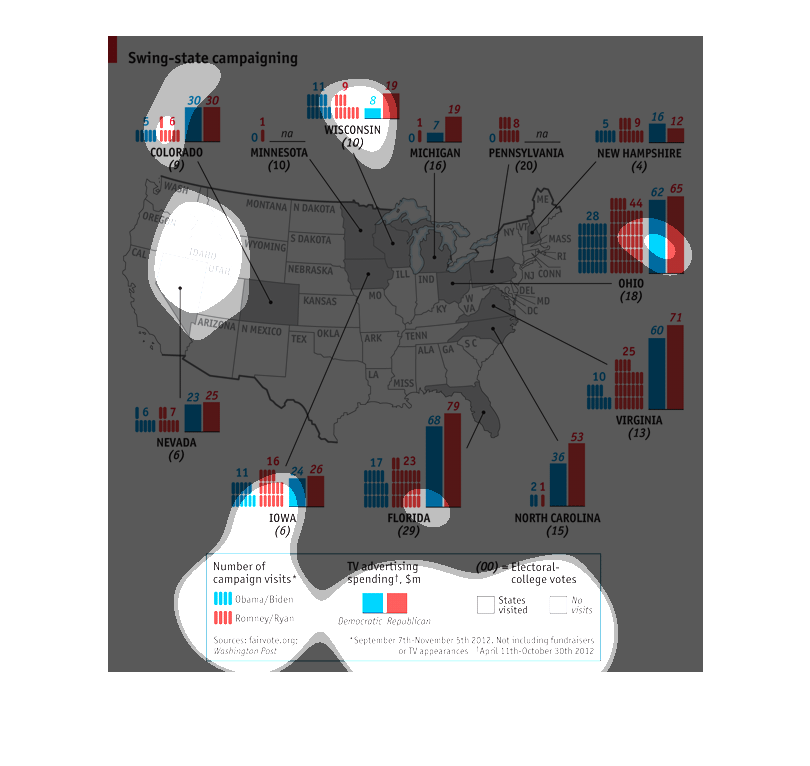
The charts shows the swing state campaigning done by Obama and Biden as well as Romney and
Ryan during the 2012 Presidential election. The chart shows whether they visited each continental
state or not, how many visits to each, and how much was spent on TV advertising in each state.
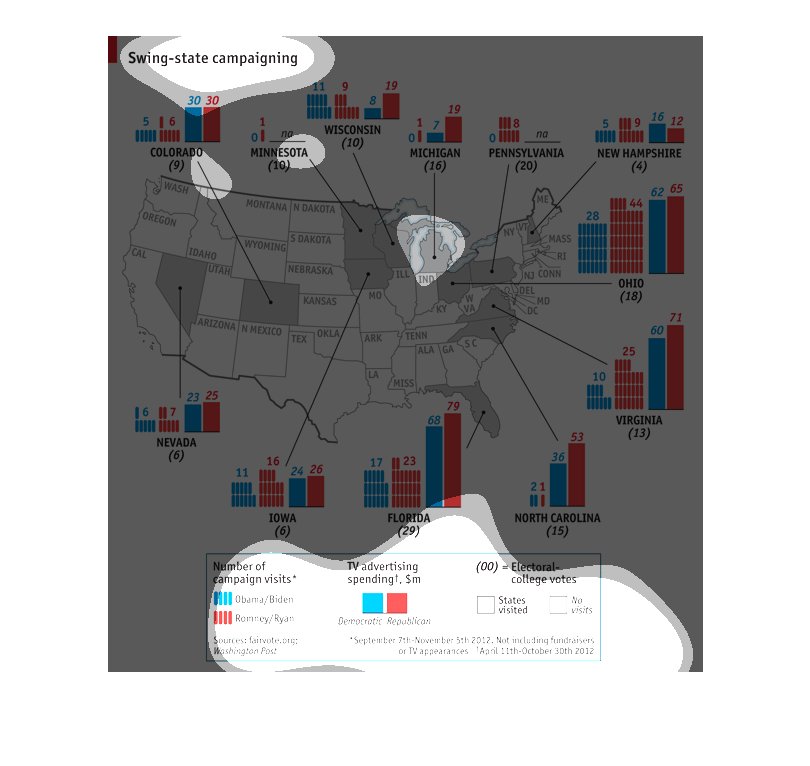
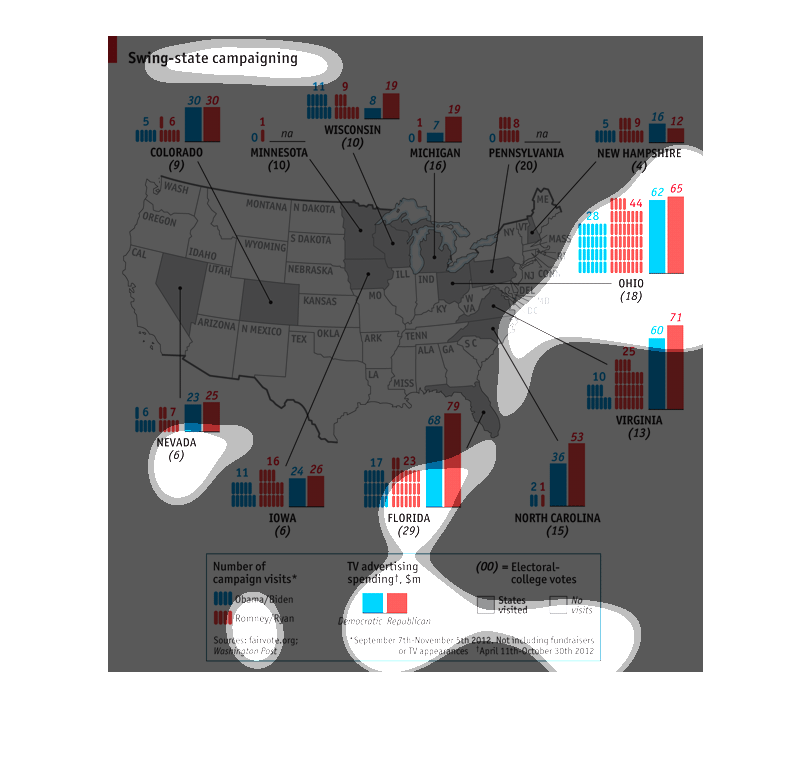
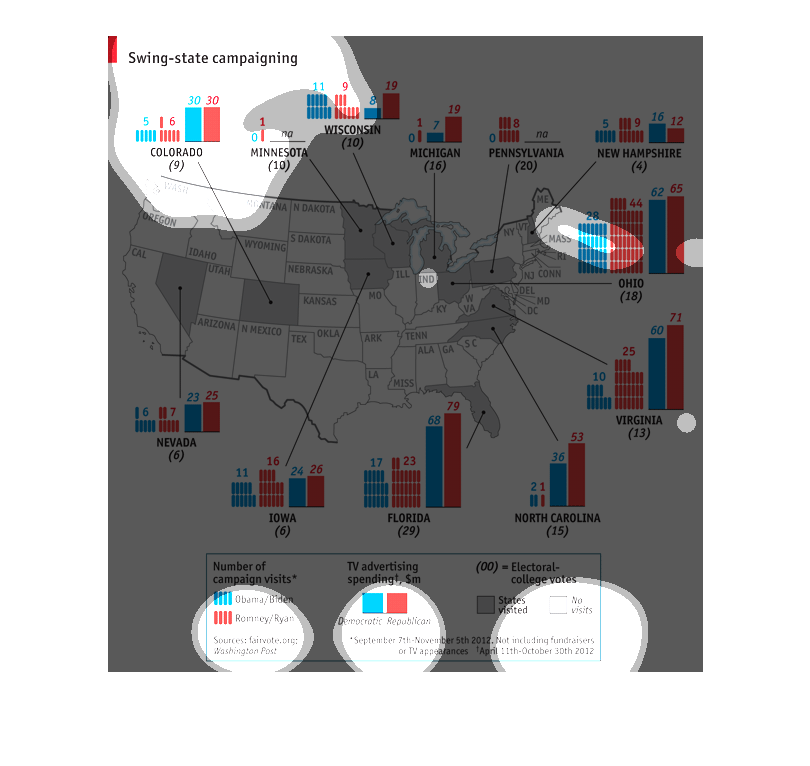
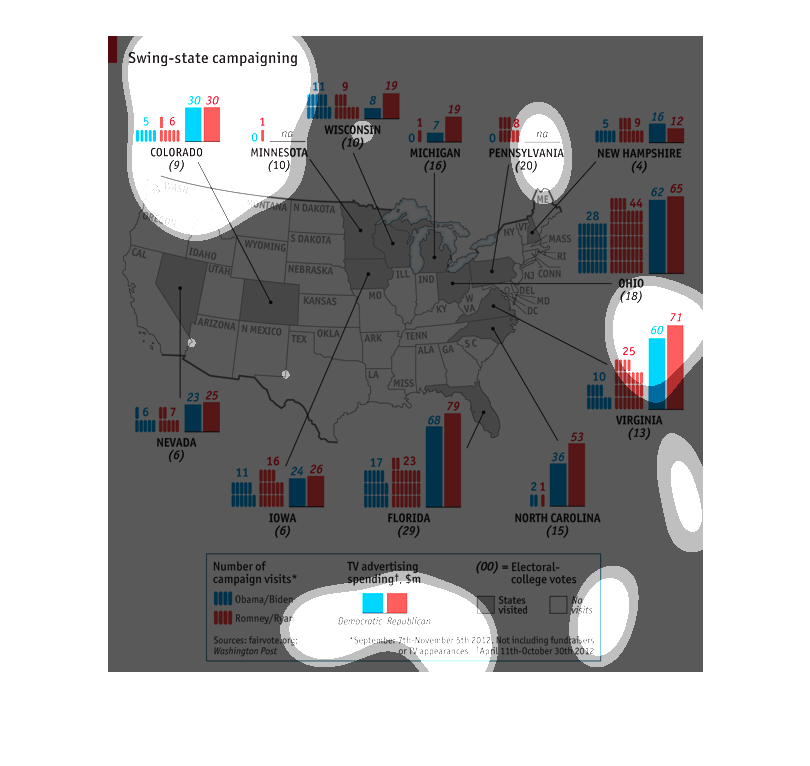
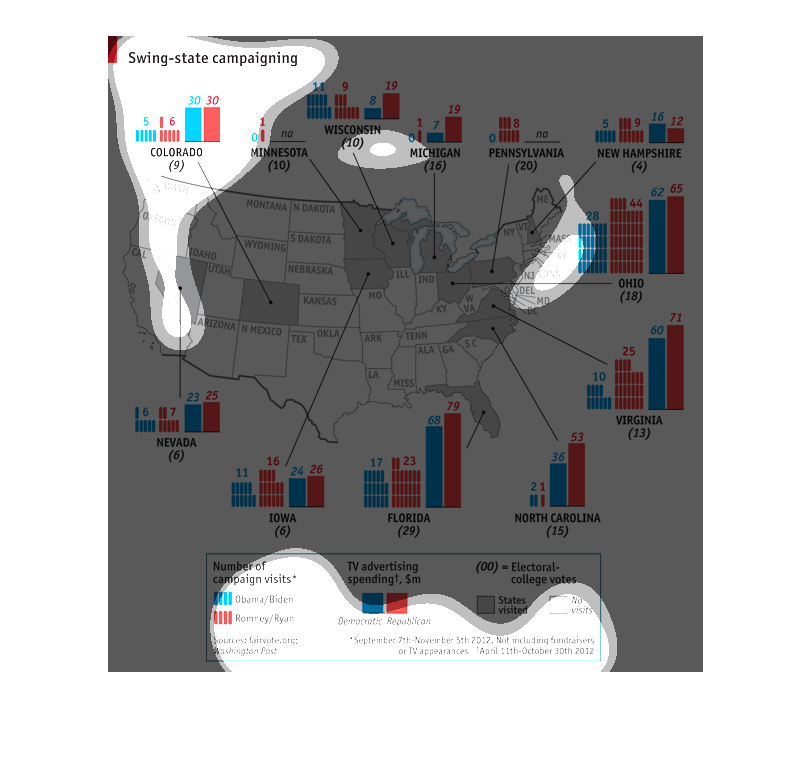
This is a political map that shows the swing states votes for the election. It shows the comparison
between Barack Obama and Jone Biden versus Mitt Romney and Paul Ryan
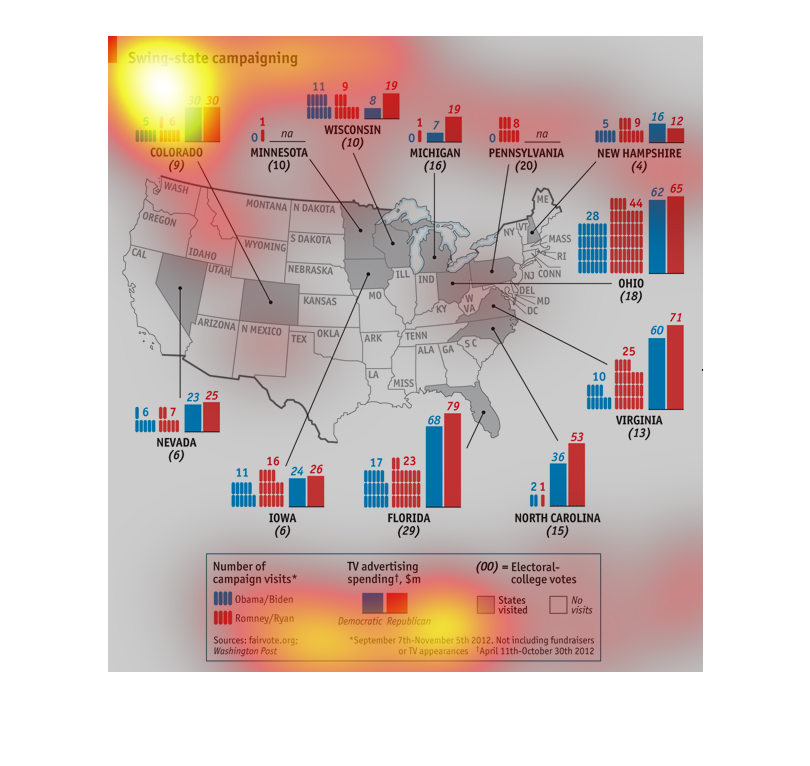
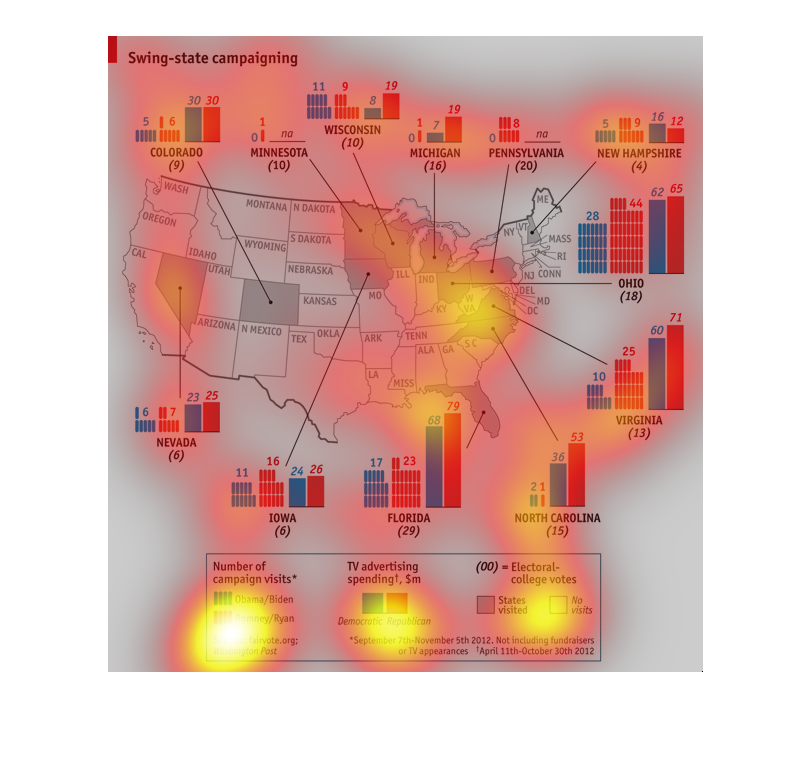
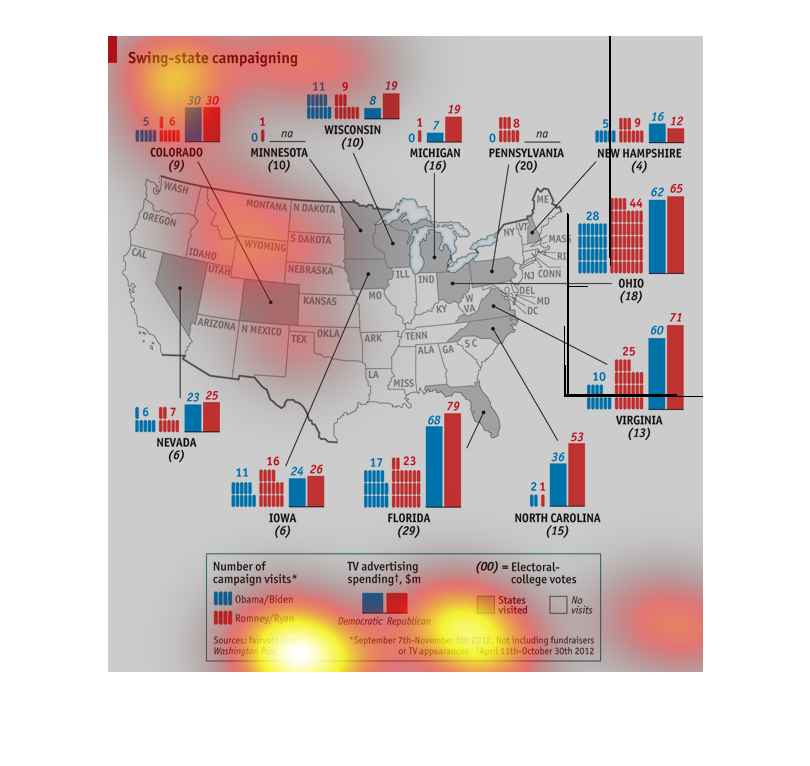
A graph showing the different states of america where the election campaign candidates have
visited and what and how much of an impact they made while there. This graph also shows the
television campaigning that was done over the course of the states involved.
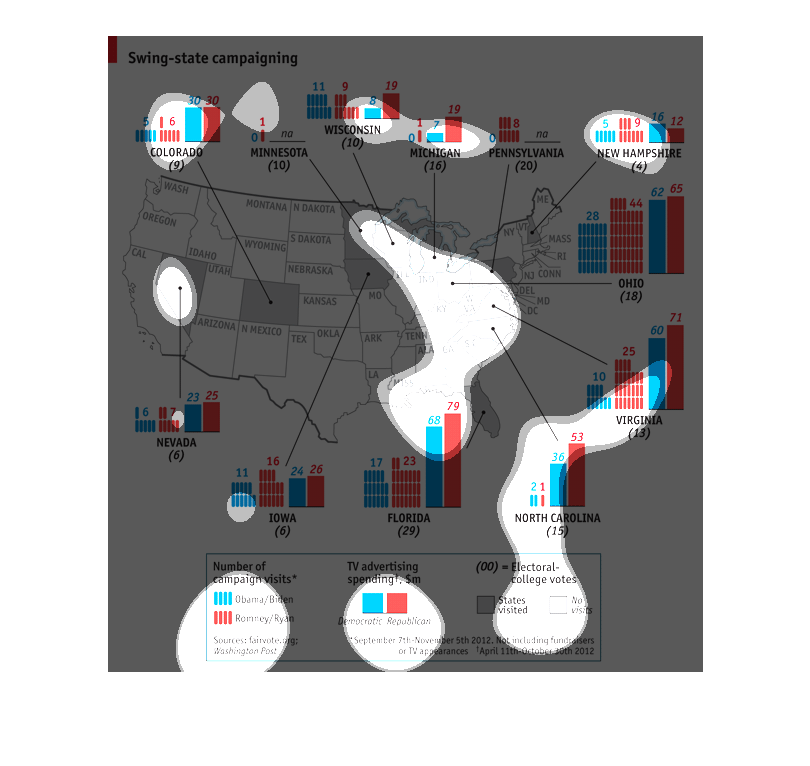
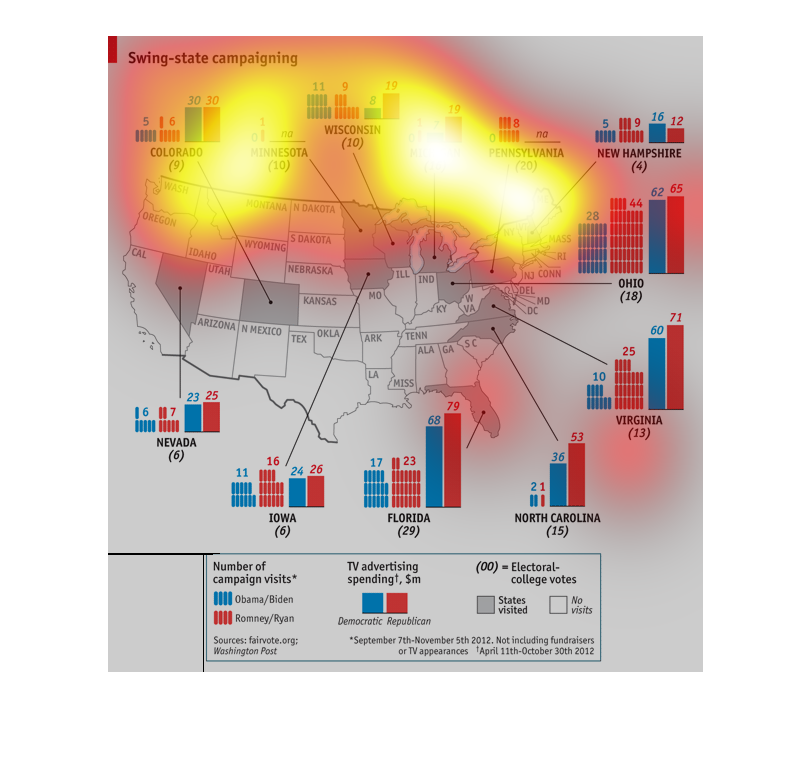
This chart describes swing state campaigning. The following states are listed as swing states.
According to this graph, the republican party spend considerable more on campaigning in each
swing state. Also, the republican party in general visited the swing states with greater frequency.
This graphic/map shows swing state campaigning in the 2012 election. It breaks down the number
of visits from each of the candidates to a particular swing state, as well as the number of
dollars spent in TV advertising (in millions). It also includes the number of electoral votes
that are assigned to each swing state.
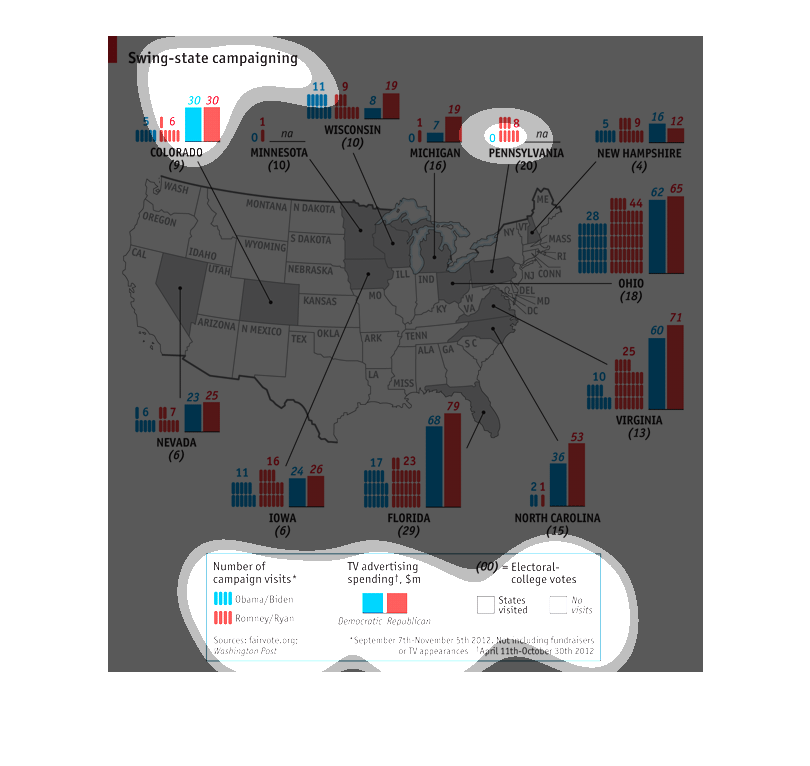
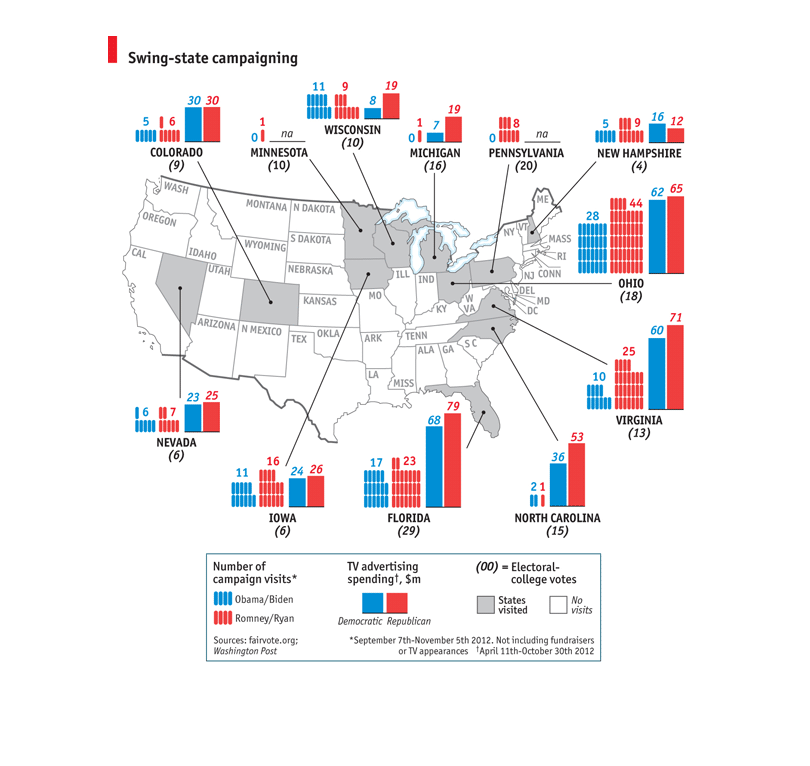
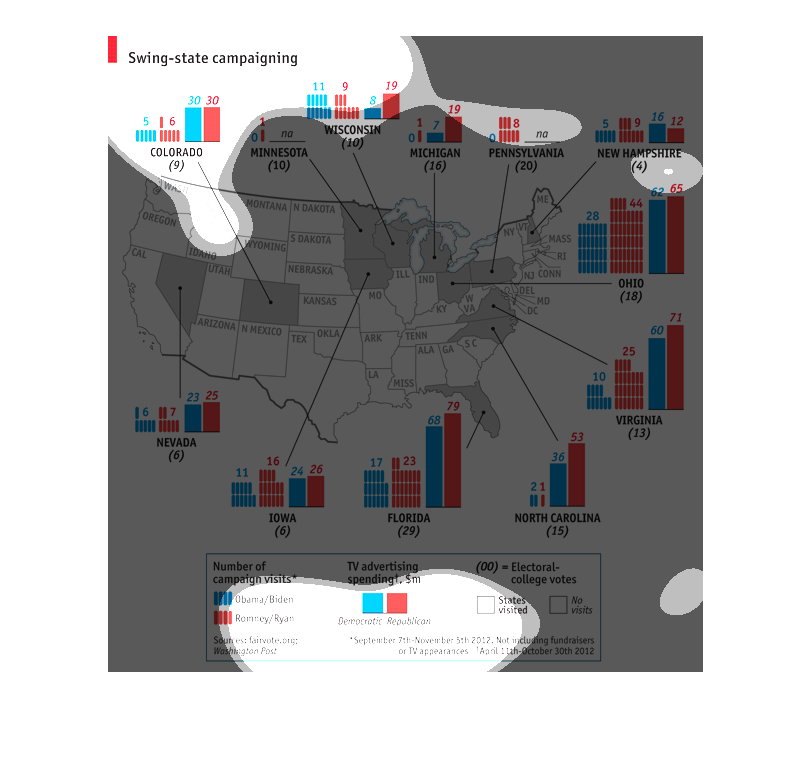
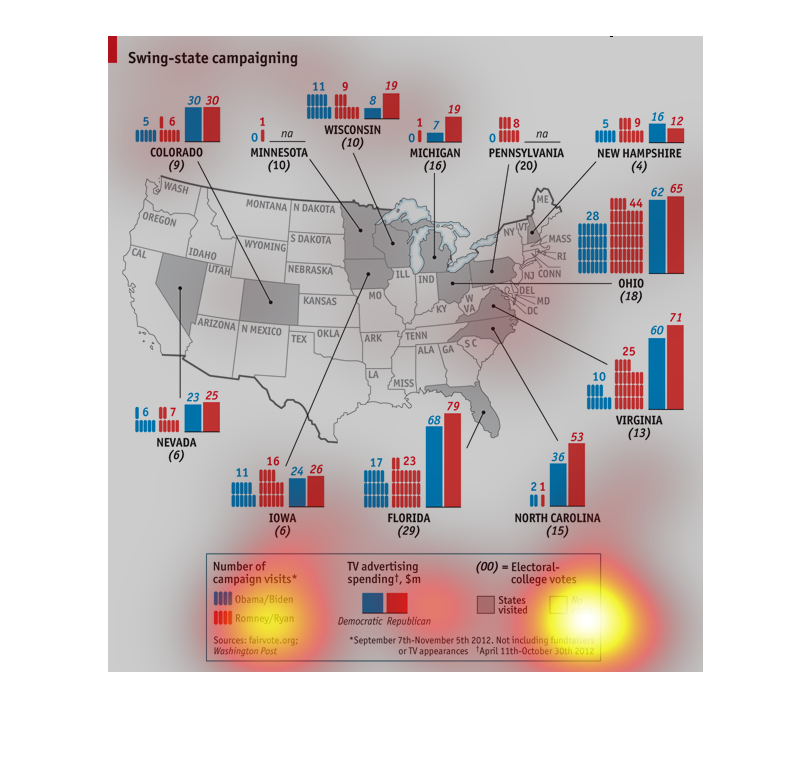
This is a map of the Unites States depicting swing states in terms of the presidential election
of 2012 between Barak Obama and Mitt Romney, including several metrics including television
advertising spend.
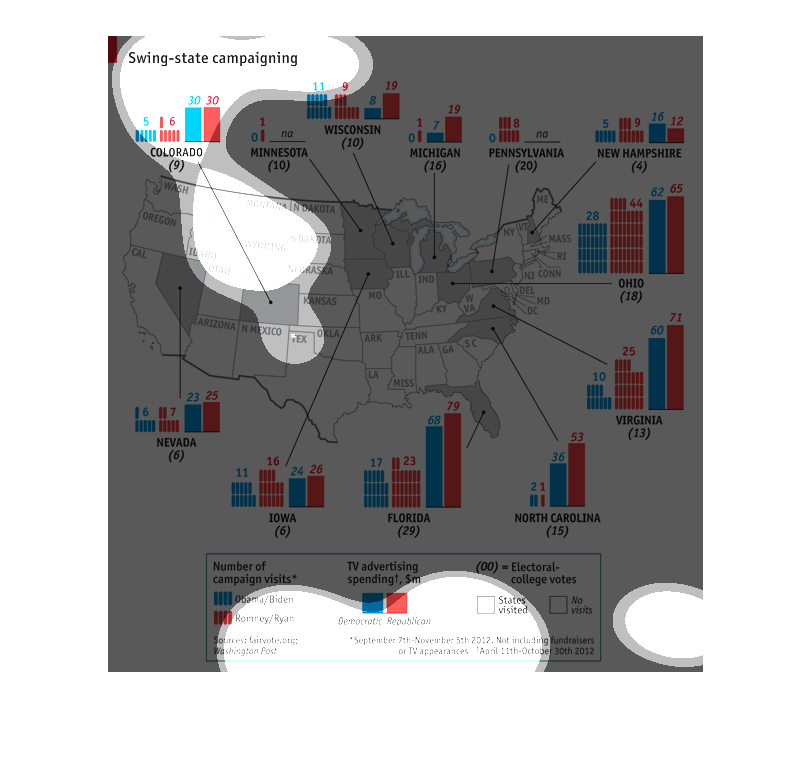
This looks at the previous election and how Obama and Romney spent money on TV advertising
and where they visited, but just in the swing states. Overall, Romney tended to spend more
money and make more visits.
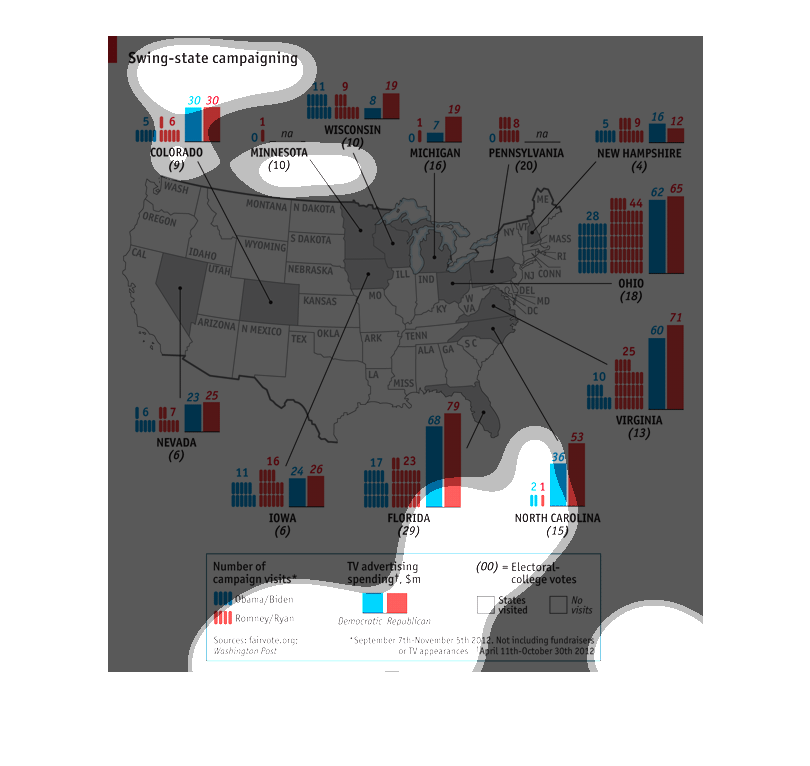
A map of the amount of campaigning done in swing states for the Obama and Romney campaign
of 2012 listing amount of television advertisements and visits.
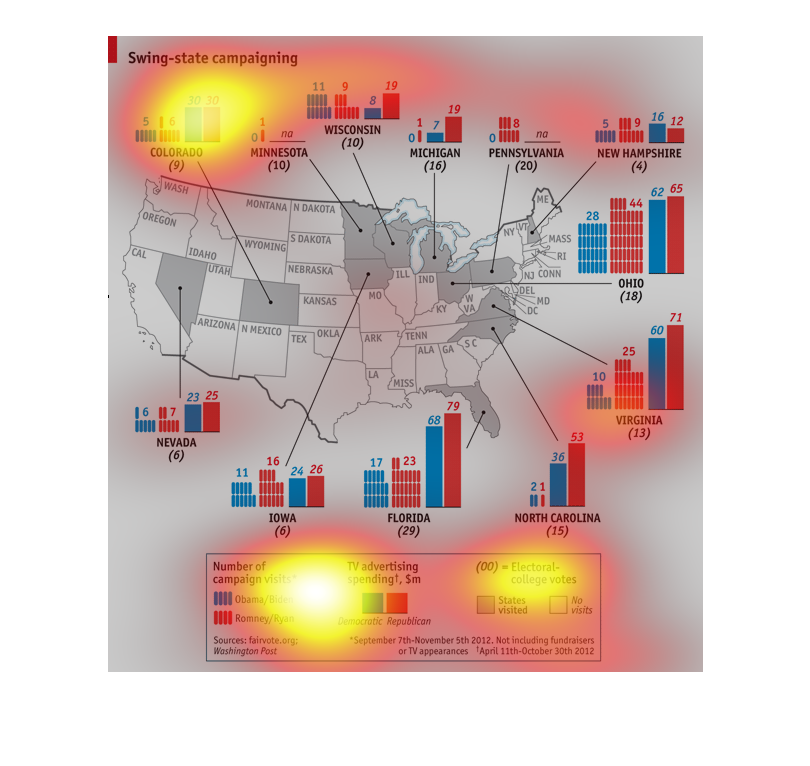
The heading reads "Swing State Campaigning" It then goes on to show different states such
as  Colorado, Wisconsin,New Hampshire, Ohio,Virginia,North Carolina, Florida,Iowa and Nevada
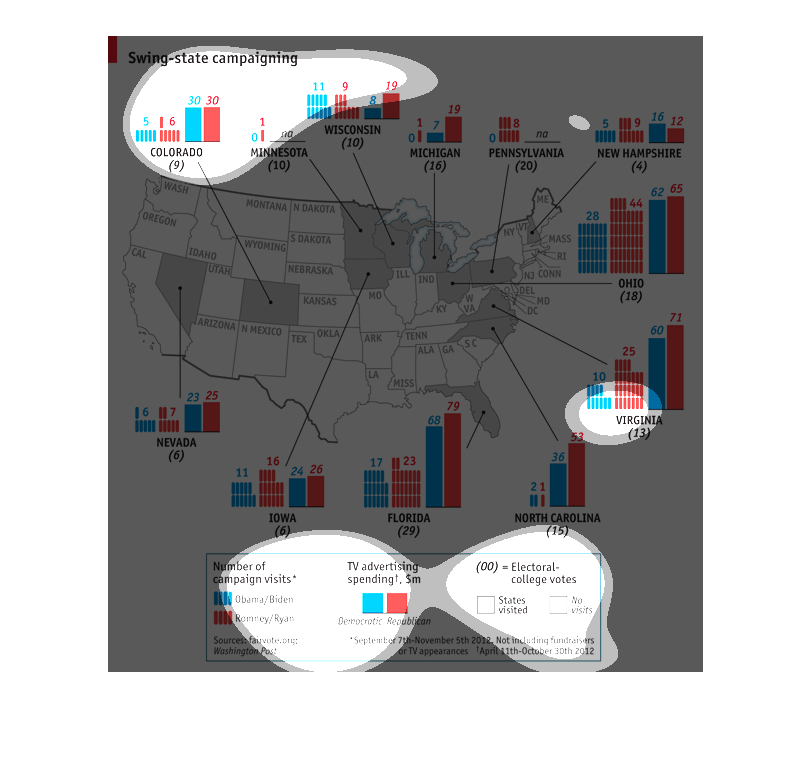
This diagram describes swing-state campaigning, specifically visits by presidential and vice
presidential candidates and advertising spending during the 2012 election. It also notes which
states were visited during the campaign and their votes in the electoral college.
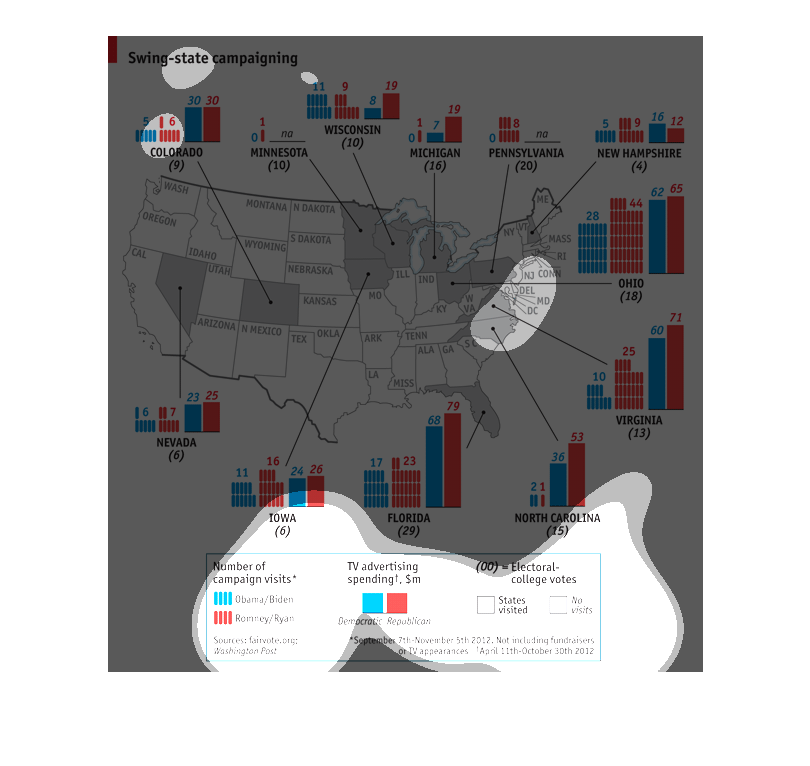
This is a chart detailing "Swing state campaigning". It shows the 12 swing states for 2012,
the number of visits by the republican and democrat candidates, and the electoral college
votes.
This chart is showing results of an election. Specifically targeting the swing states in that
certain election. States include Pennsylvania and Minnesota.
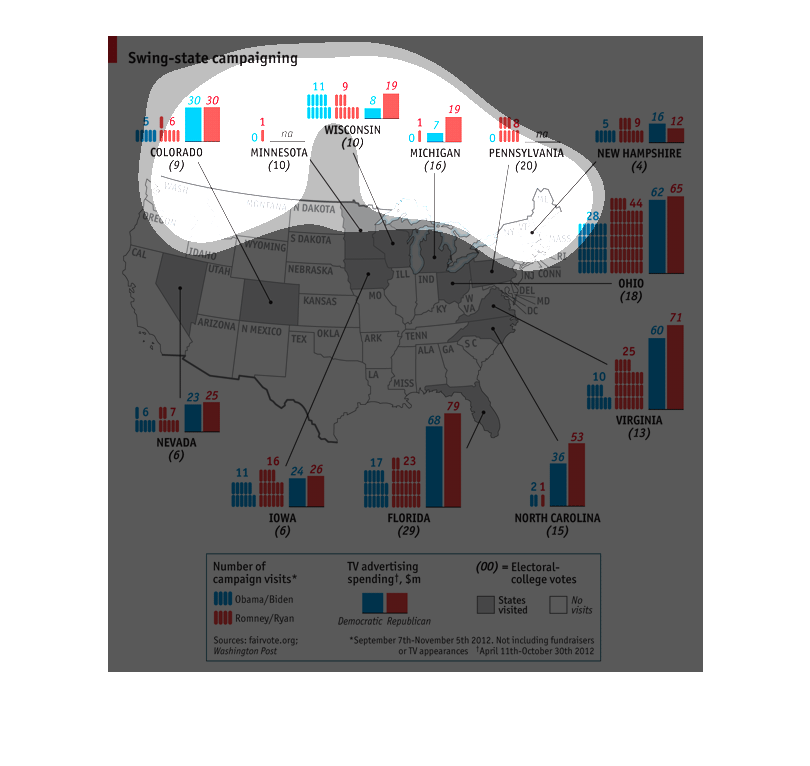
The image depicts swing state campaigning during the 2012 election by candidates Barack Obama
and Mitt Romney. Graphs present both amount of visits to swing states as well as TV advertising
spending.
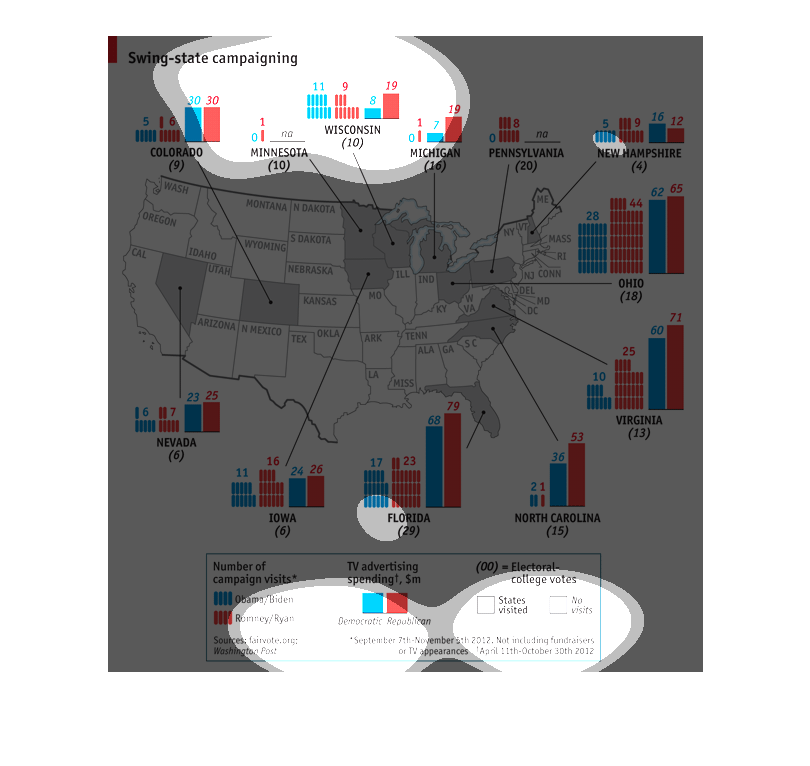
This is a map that shows how much money each of the political parties spend on campaigning
in the different swing states. The money spend is generally even between parties and the state
where the most is spent is Ohio.