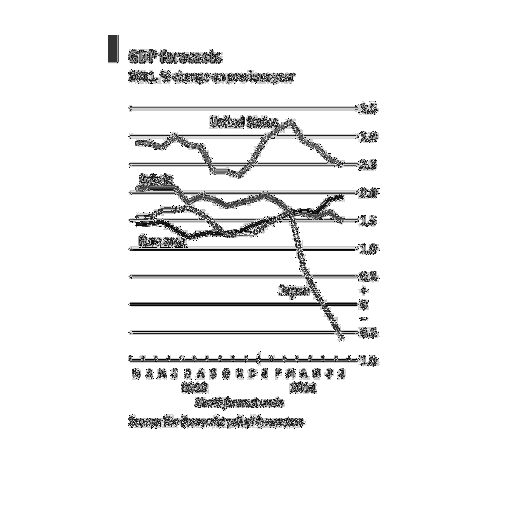
This chart show the percent change in GDP for several countries. It shows the trend for 2011
compared to 2010. The data is broken down on a monthly basis.
Error using .*
Matrix dimensions must agree.

Error in plotSpotlight (line 30)
    output = repmat(a,[1 1 3]).*single(im)/255;

Error in plot_individual_user_maps (line 49)
        [heat] = plotSpotlight(im,heatmap,3);