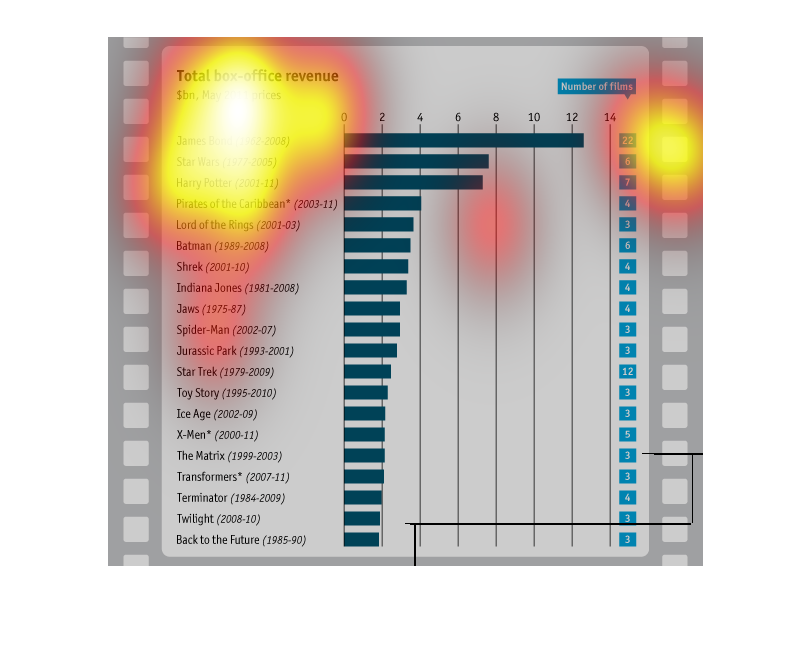
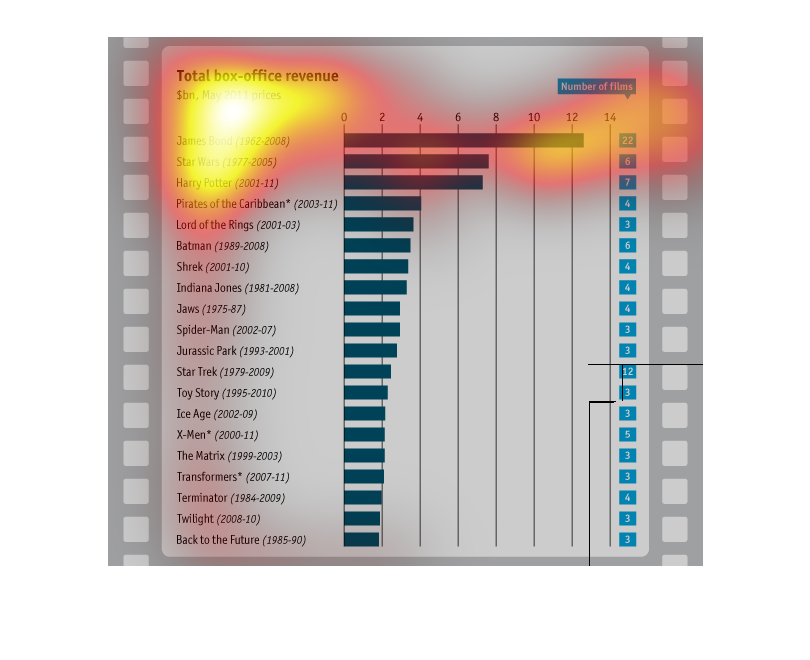
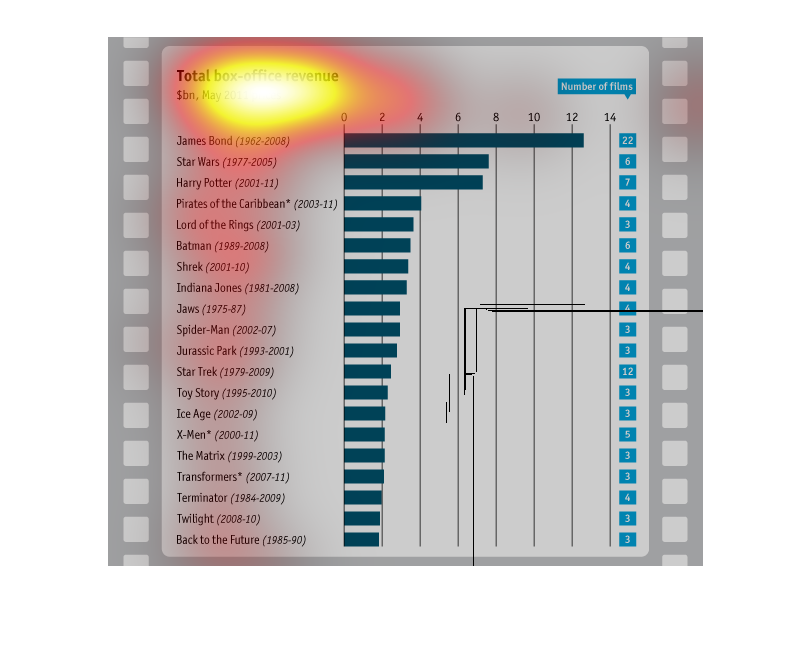
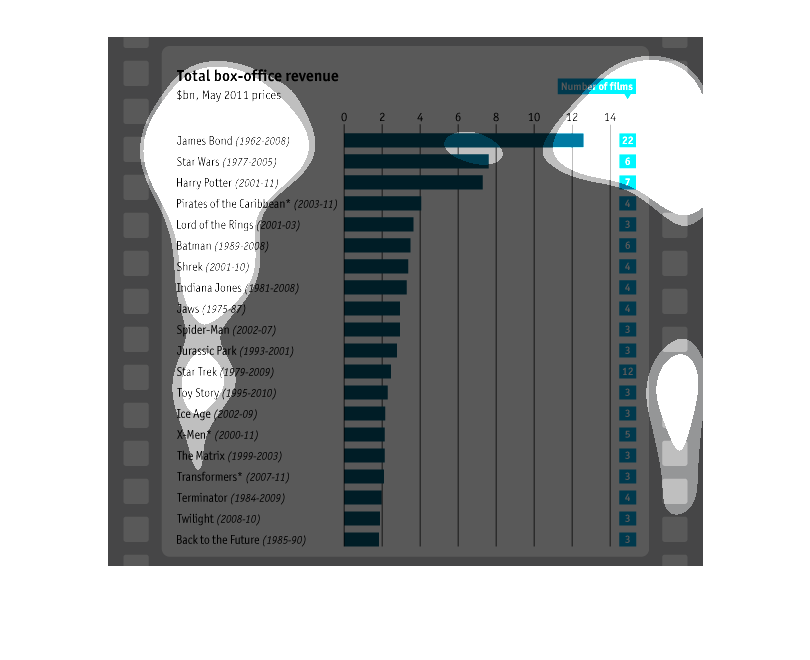
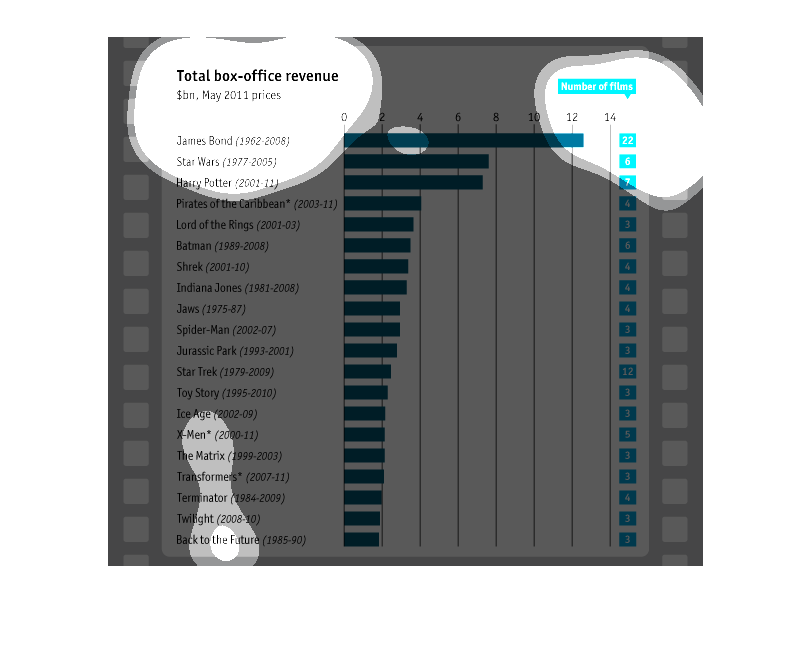
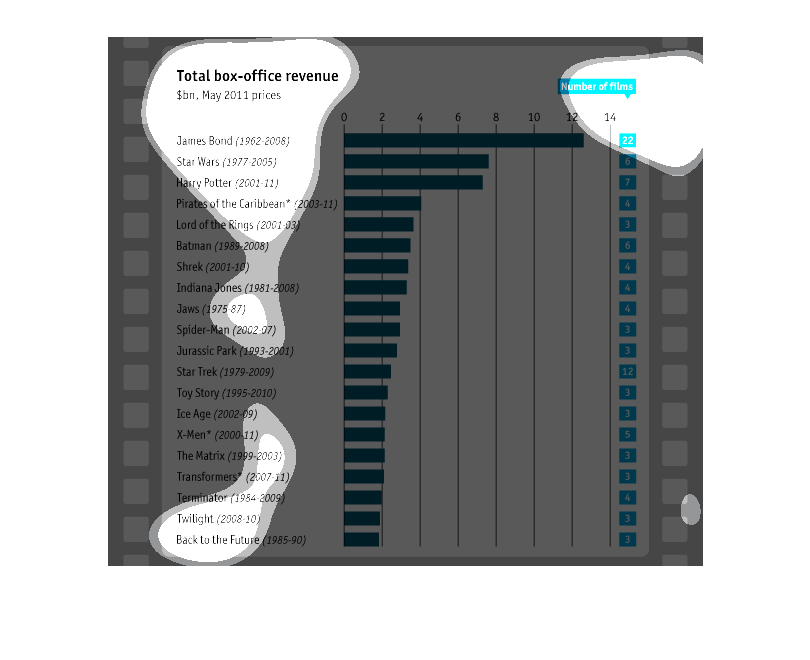
In billions, this shows May 2011's prices for box office revenue for franchises. Overall,
James Bond and Star Wars lead the pack at 13 and 8 billion (though Bond has 16 more films).
The lowest-earning trilogy is Back to the Future, sadly lower than the Twilight abomination.
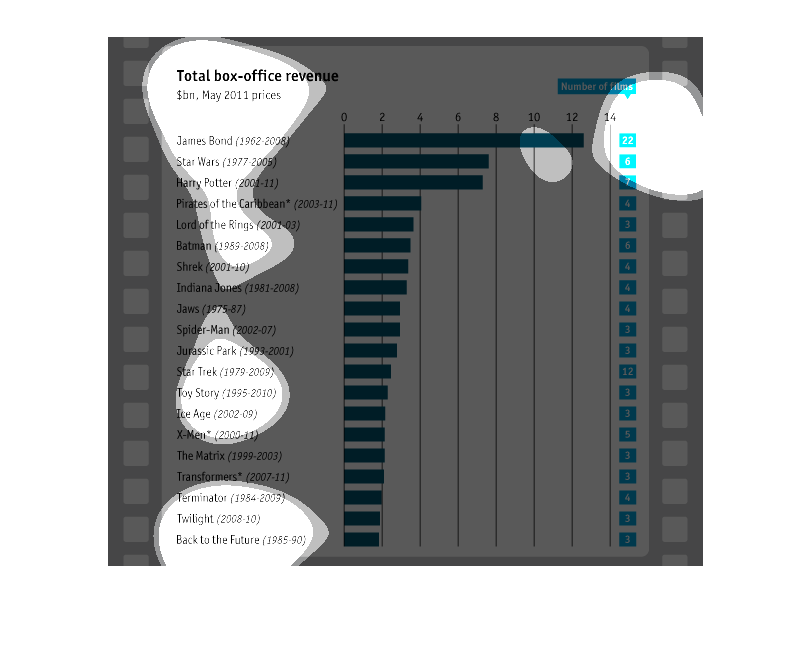
This chart is a bar chart of the number of films in a series i.e. James bond (with the most).
It is ordered in descending order bases on the number of films in series.

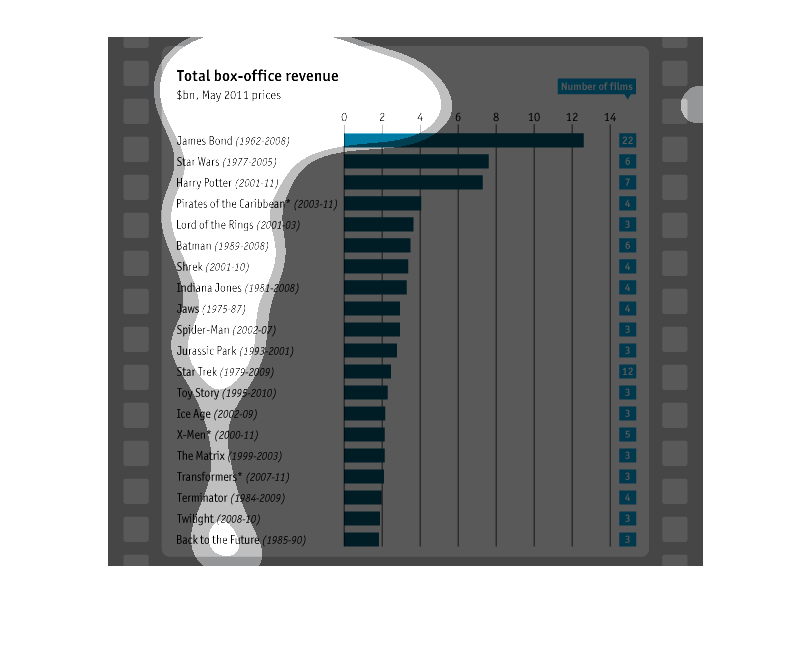
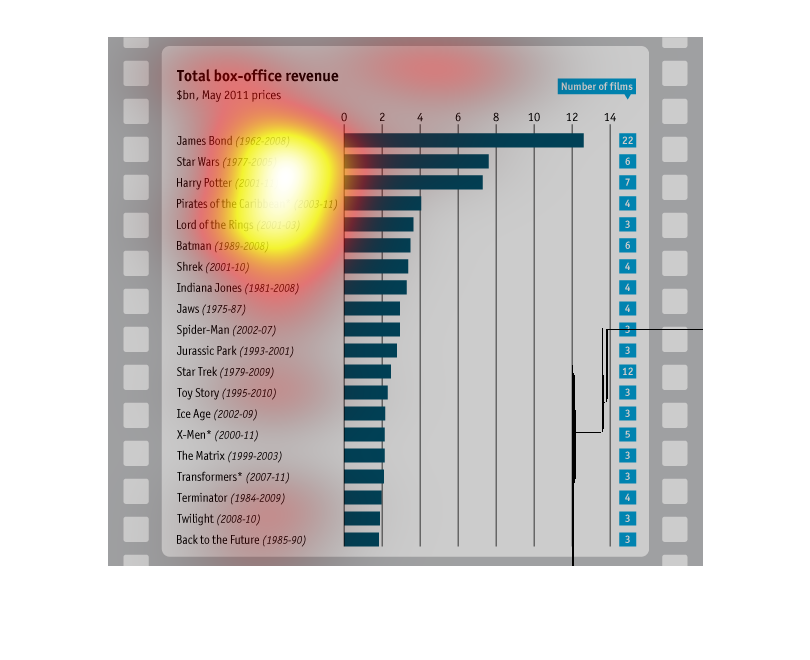
This chart shows box-office revenues in the billions compared to the amount of films in that
particular series with the James Bond series topping the list, circa May 2011.
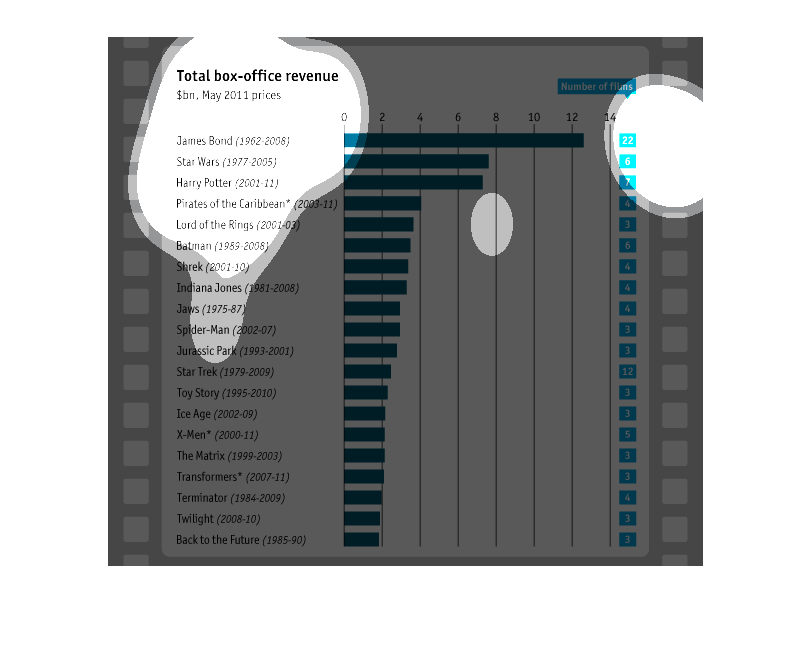
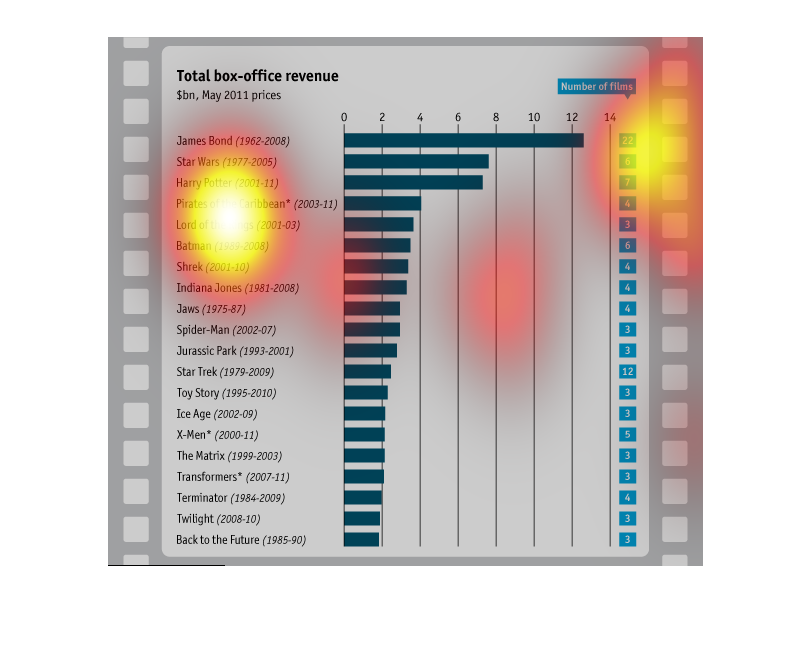
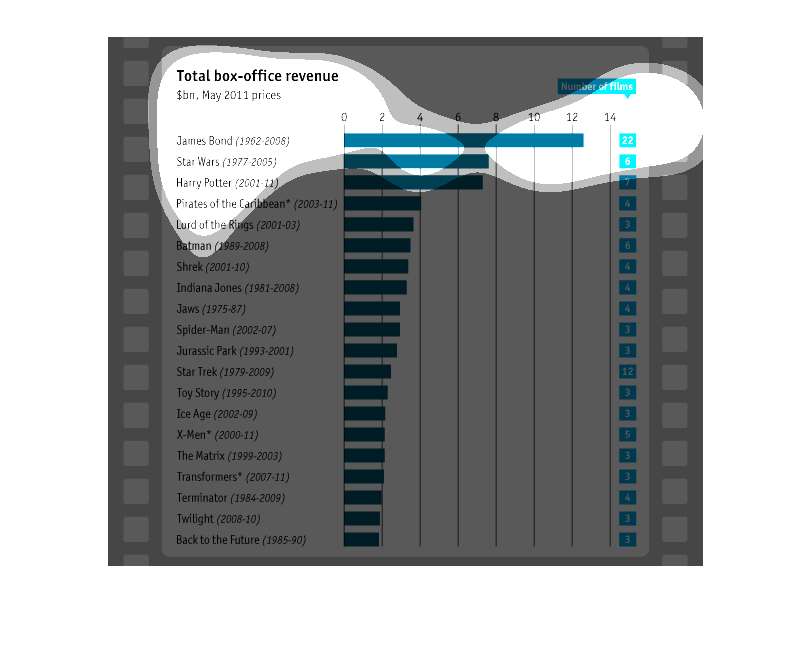
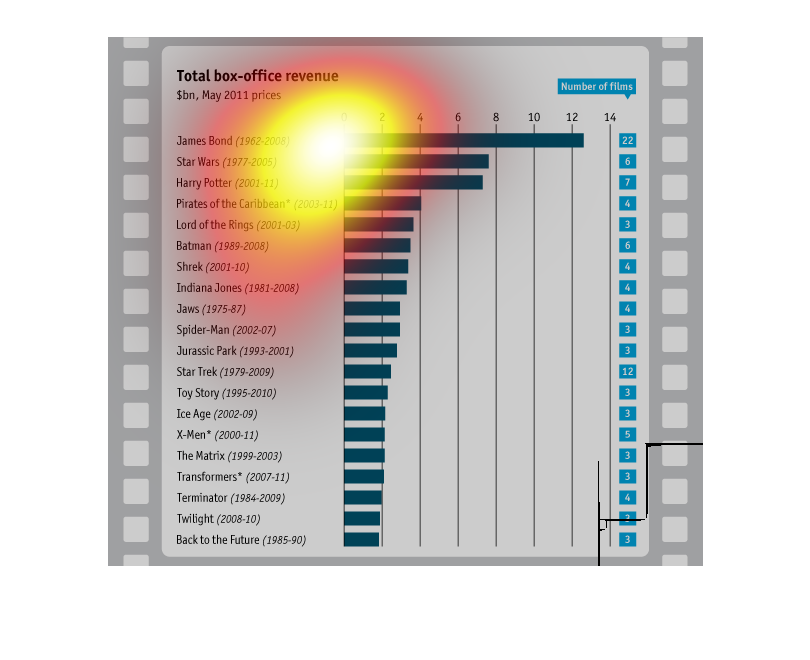
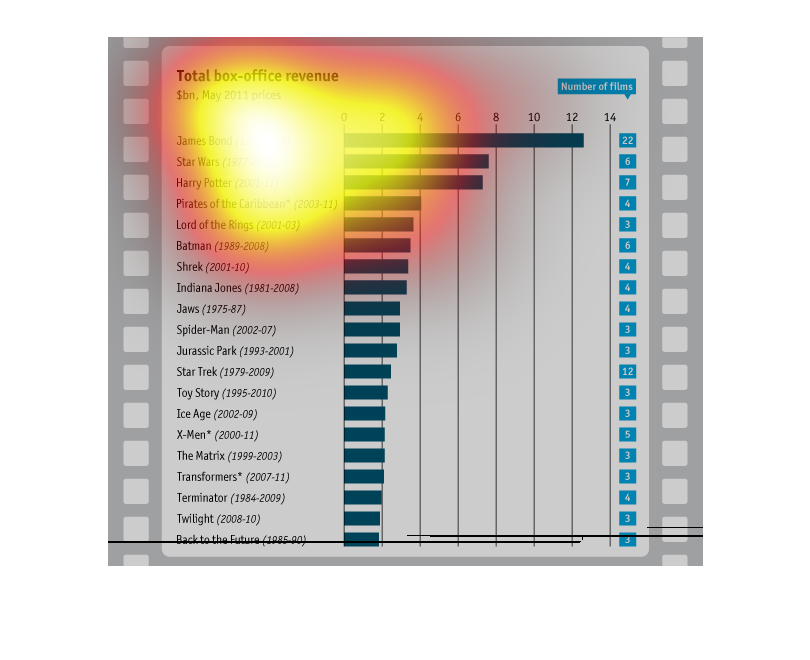
This is a graph of box office revenues of different movies based on May 2011 ticket prices
for different movie series. Number one on the list is James Bond at over $12 billion over
the course of 22 movies. Number 2 is Star Wars with just under $8 Billion.
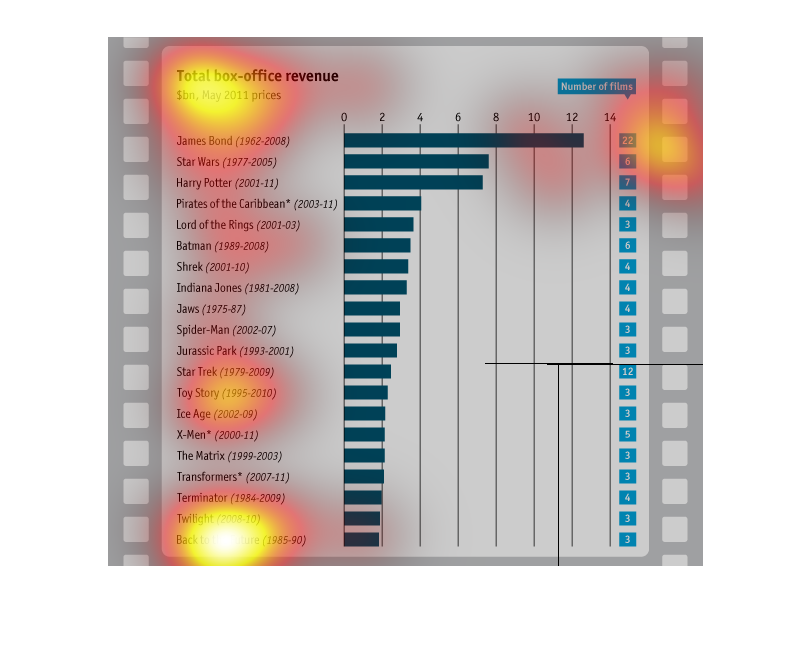
This is a chart describing the the total box office revenues from the 1980's starting with
back to the future, to 2011 with popular movies such as Harry potter.
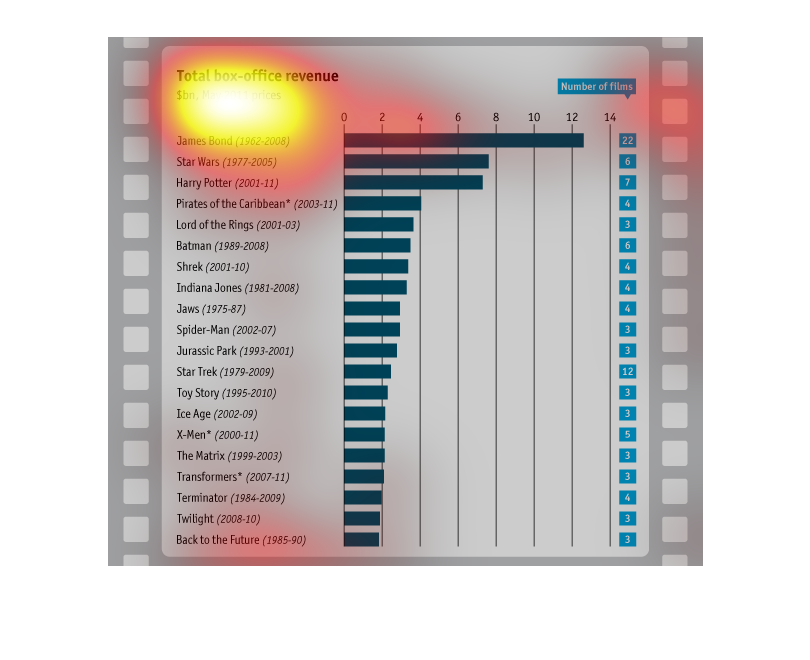
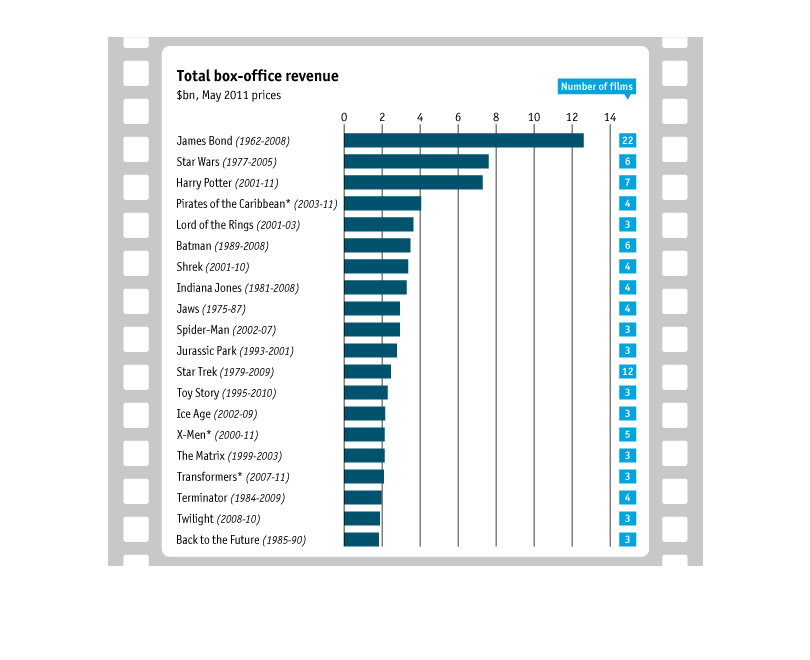
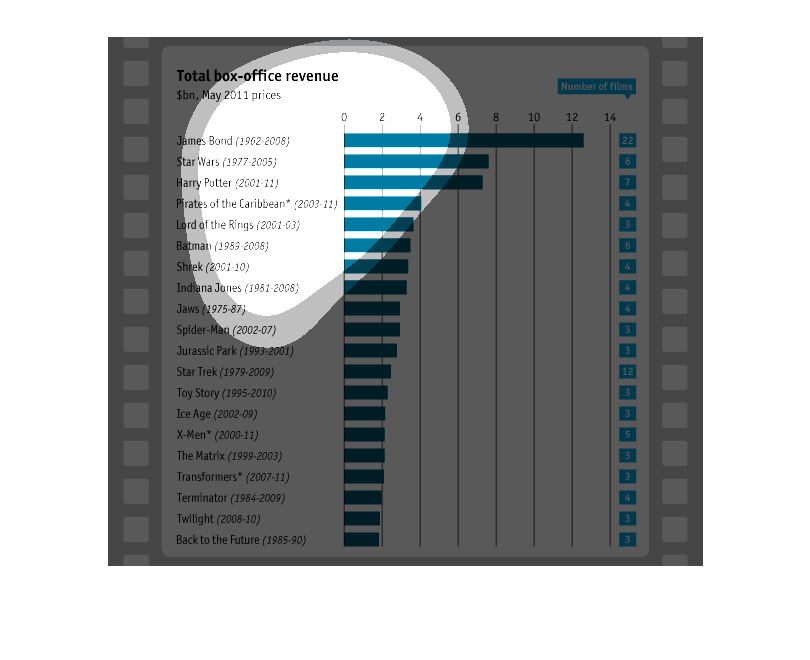
This chart shows the total box office revenue until 2011. Ranging from highest revenue to
lowest in order: James Bond, Star Wars, Harry Potter, Lord of the Rings, Batman, Shreck, Indiana
Jones, Jaws, Spiderman, Jurassic Park, Star Trek, Toy Story, Ice Age, X-Men, The Matrix, Transformers,
Terminator, Twilight, Back to the Future.
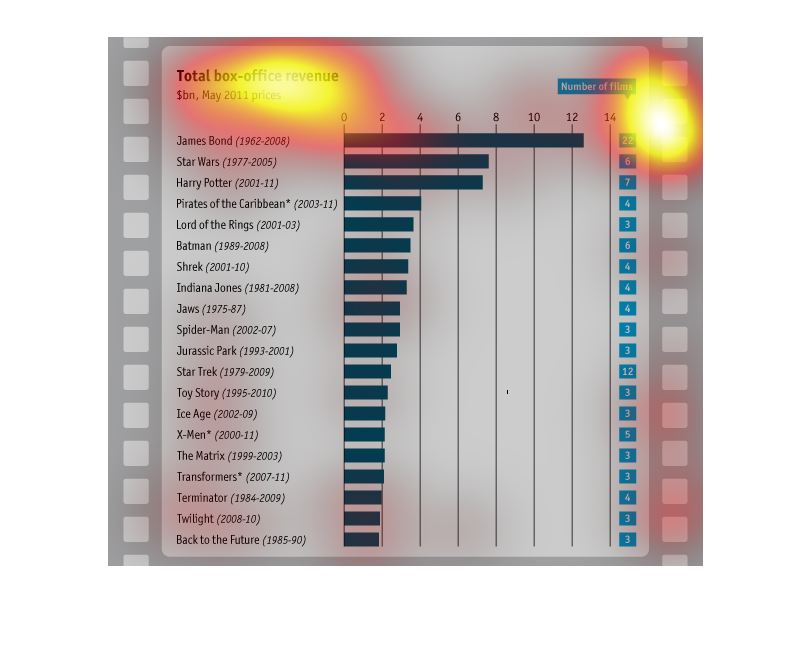
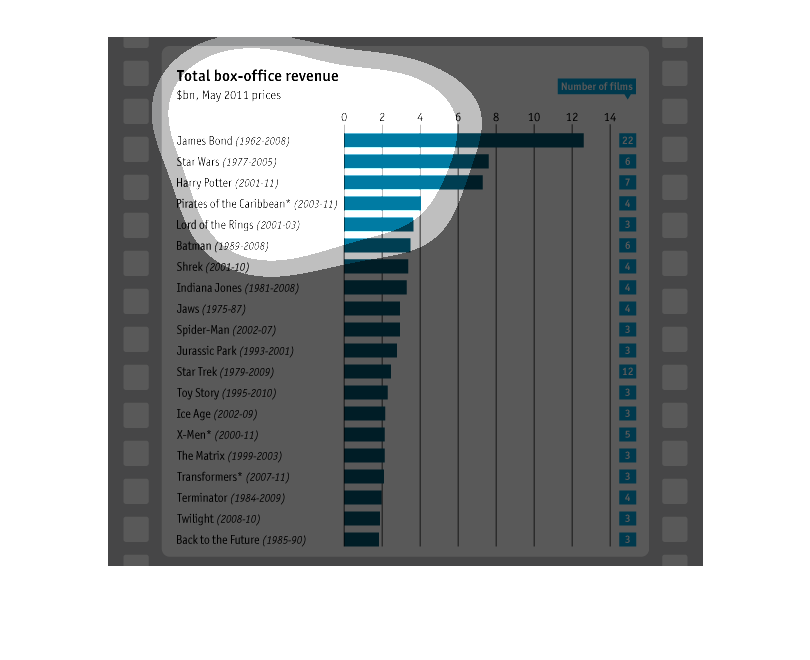
This graph shows the total box office revenue by film franchise.  The numbers are shown in
billions and the films show the date ranges of the releases.  The money is shown in 2011 dollars.

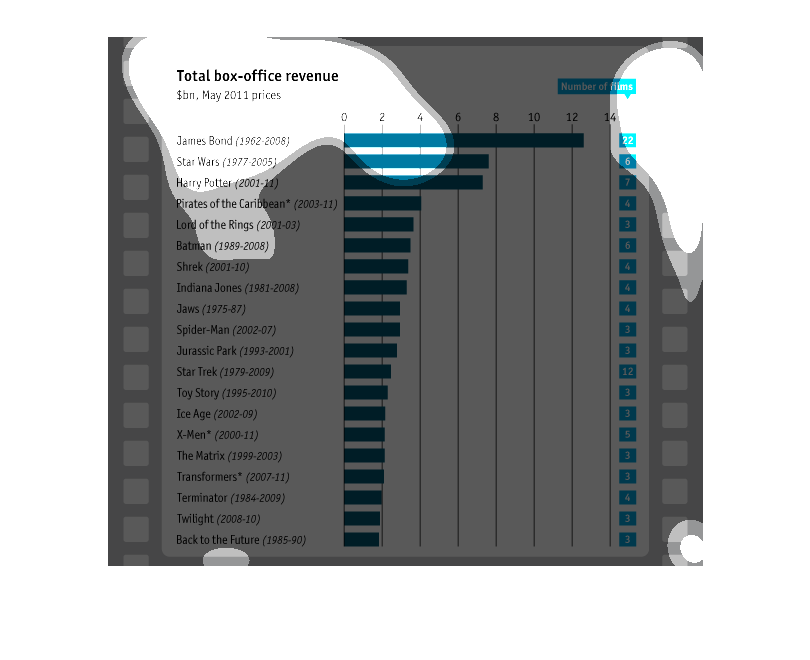
This chart shows the revenues and rankings of movie franchises. The James Bond movies have
made the most money, but also have the greatest number of movies, at 22. Star Wars and Harry
Potter movies have also done quite well, considering they only have 6 and 7 movies, respectively
in each of those franchises.
A graph titled "Total Box Office Revenue".  It provides a list of movies and the total amount
of money they've made while in cinema, with the blue bars next to them indicating how much.
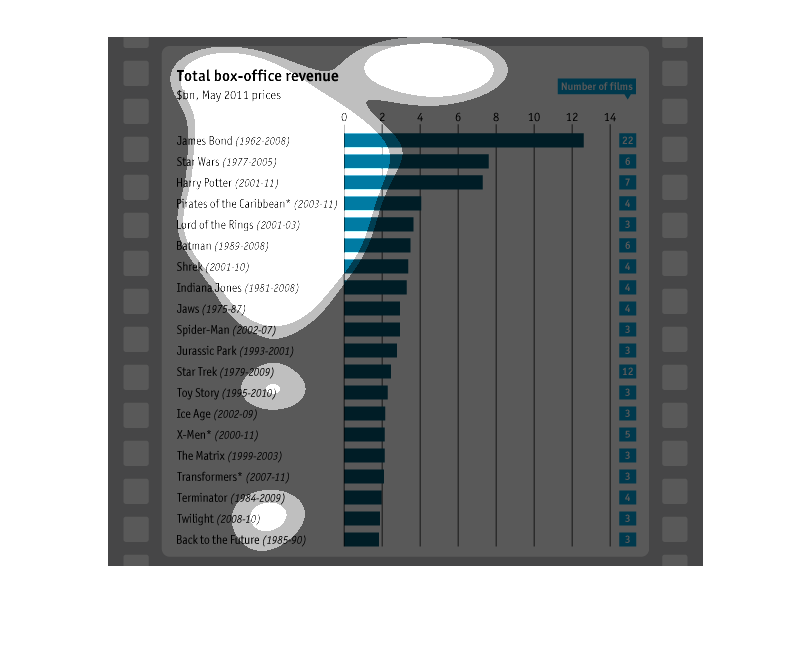
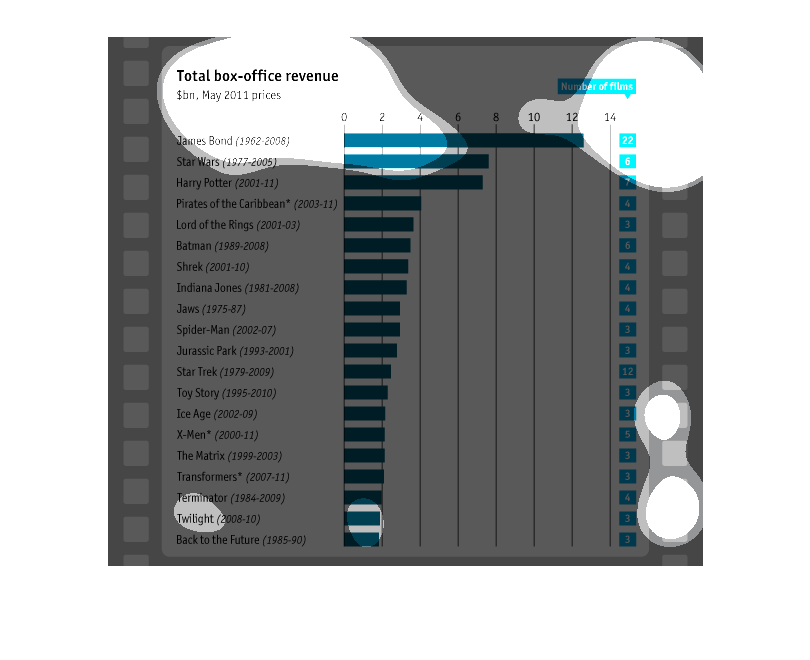
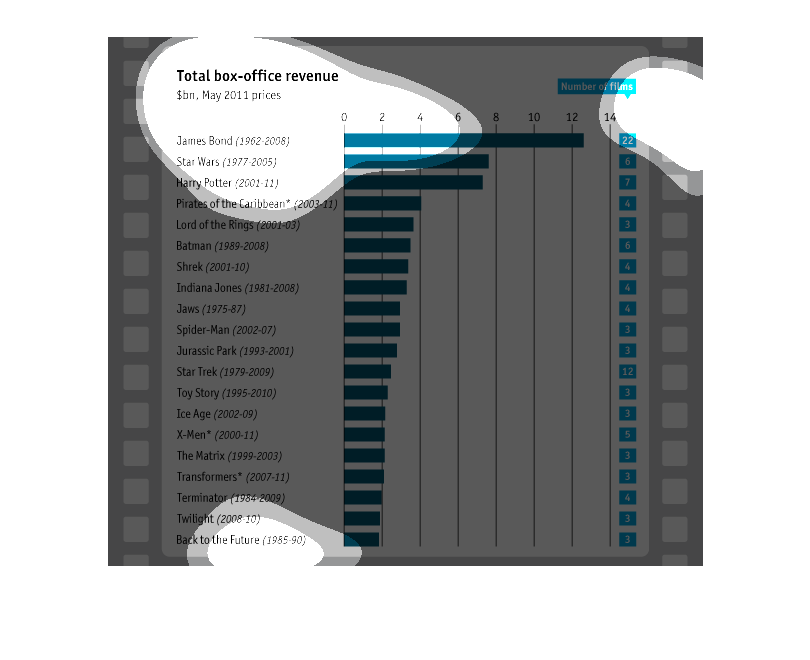
This chart shows total box office revenue for May 2011 prices. The chart is showing movie
series, such as Star Wars, and is showing the total revenue for all films. It shows the number
of films in the series and the total revenue in billions of dollars.
Total box revenues of movie franchises in billions for May 2011 period. Top revenues are James
Bond series, followed by Star Wars and Harry Potter with Pirates of the Carribean and Lord
of the Rings following
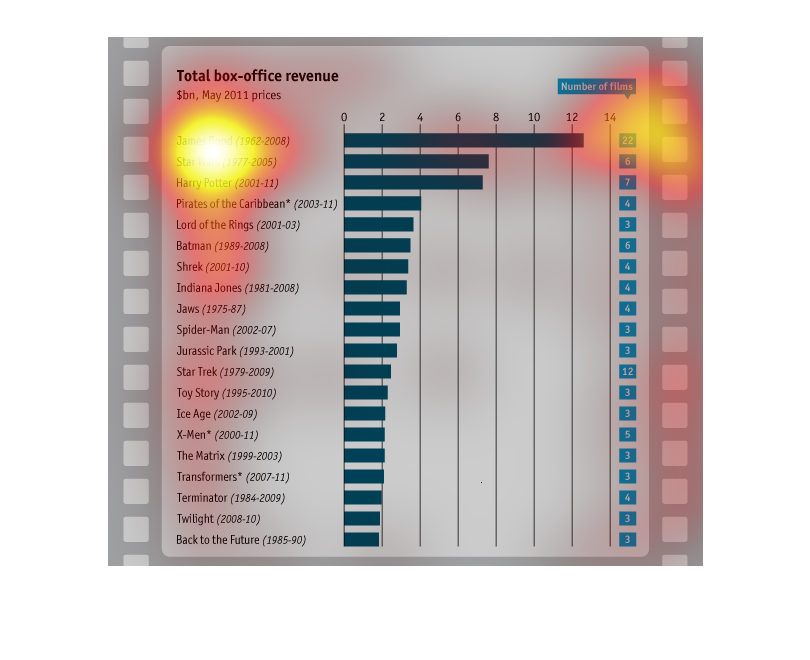
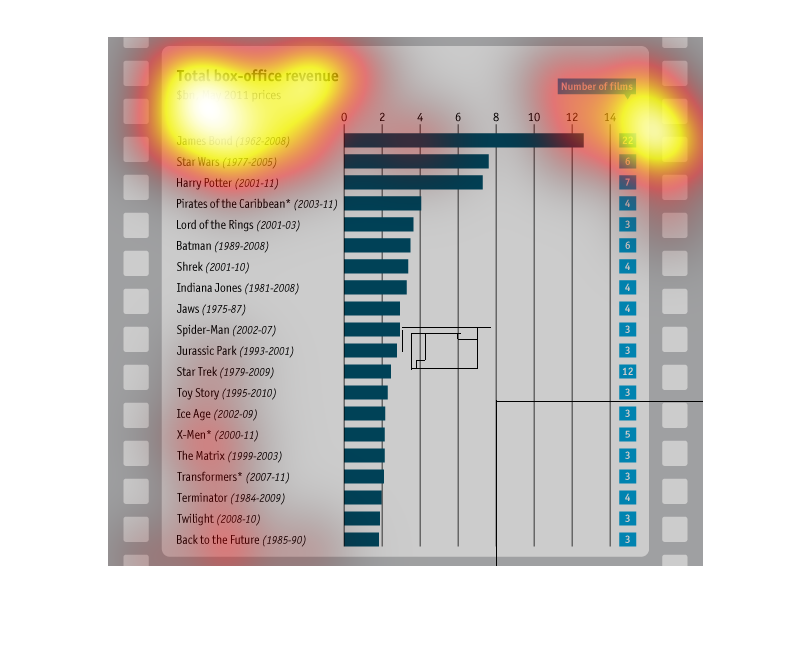
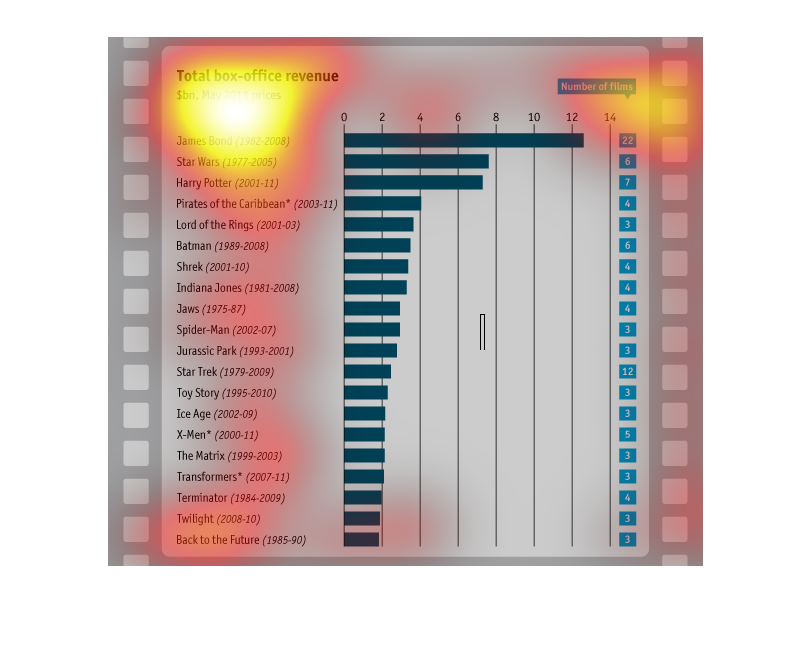
This graph shows box-office revenue of popular film series as of May 2011. The revenue earnings
are shown in billions of dollars. Every shows the range of years in which the films were released,
and each series has at least 3 films (that information is shown in the column on the far right
side of the graph) and the series with the most films is James Bond, with 22 films. James
Bond was also the longest running series (1962-2008), the series with the earliest released
first film and the series with the highest total box office revenue, at over $12 billion.
Back to the Future (3 films) earned the lowest amount with just under $2 billion. There is
no source for this graph or information.
This graph represents the total box office revenue for different movies from May 2011.  The
top grossing movies included the James Bond series, followed by Star Wars.
this graph is about the total of box offices around the world. the blues stands for the number
of films.and the green is the name of movies that have been watched.