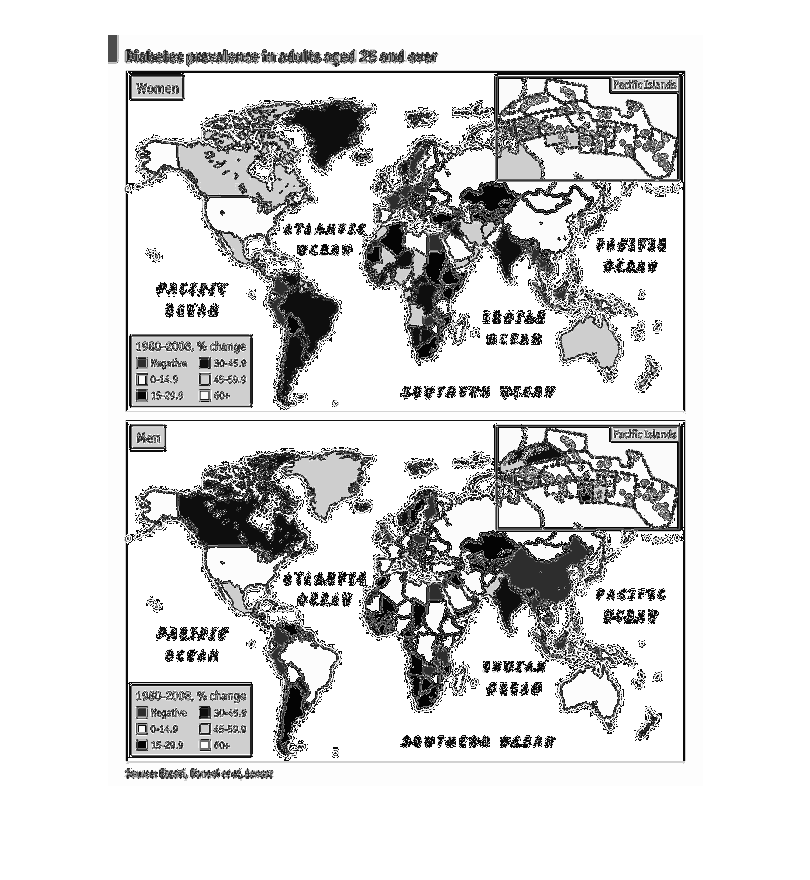
The image provides the net percentage change in diabetes, between 1980 and 2008, in almost
all countries on a world map; a separate image is used for men and women.
Error using .*
Matrix dimensions must agree.

Error in plotSpotlight (line 30)
    output = repmat(a,[1 1 3]).*single(im)/255;

Error in plot_individual_user_maps (line 49)
        [heat] = plotSpotlight(im,heatmap,3);