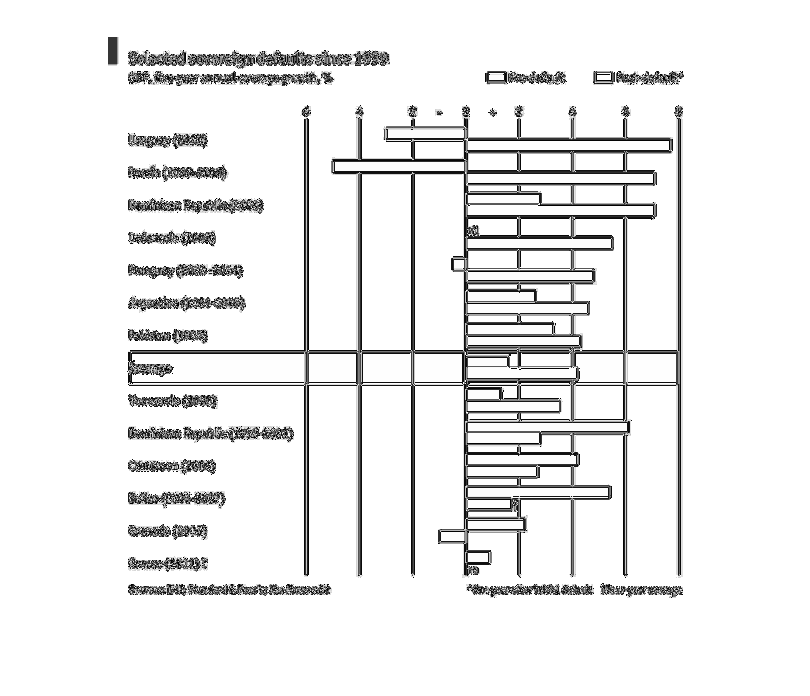
This graph is comparing nations' GDP from before the defaulted on a debt to after they had
defaulted on a debt.  It is showing five year averages of the GDP.
Error using .*
Matrix dimensions must agree.

Error in plotSpotlight (line 30)
    output = repmat(a,[1 1 3]).*single(im)/255;

Error in plot_individual_user_maps (line 49)
        [heat] = plotSpotlight(im,heatmap,3);