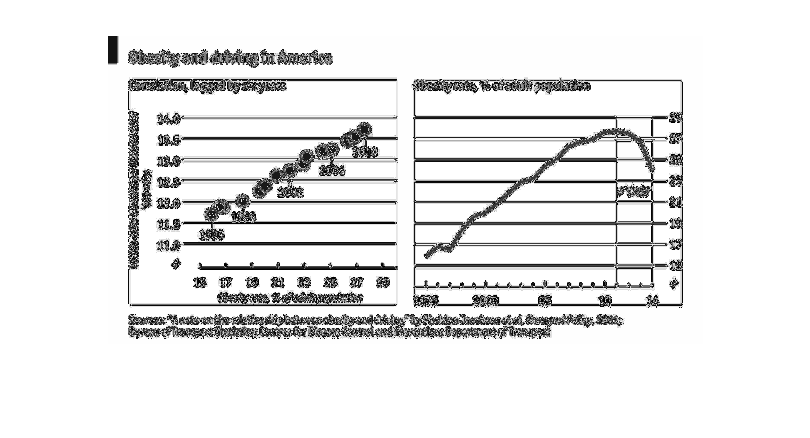
This is a chart depicting Obesity and driving in America in terms of the miles driven and
the rate of obesity and the obesity rate overall from 1995 to 2014.
Error using .*
Matrix dimensions must agree.

Error in plotSpotlight (line 30)
    output = repmat(a,[1 1 3]).*single(im)/255;

Error in plot_individual_user_maps (line 49)
        [heat] = plotSpotlight(im,heatmap,3);