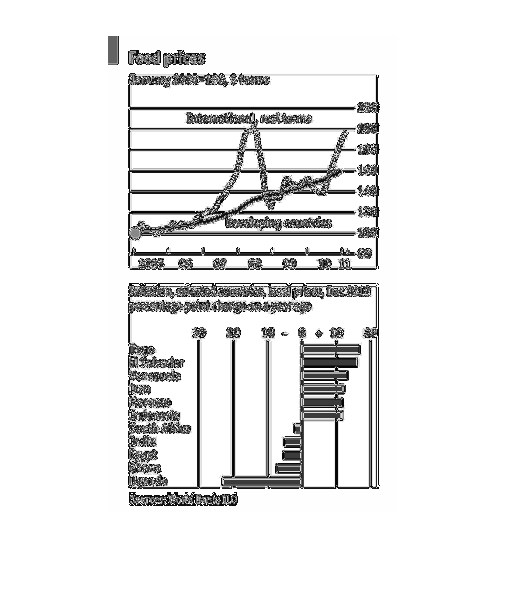
The top graph shows the prices of food from 2005 to 2011.  The bottom graph shows inflation
in selected countries in 2010 with Togo and El Salvador having the highest rates.
Error using .*
Matrix dimensions must agree.

Error in plotSpotlight (line 30)
    output = repmat(a,[1 1 3]).*single(im)/255;

Error in plot_individual_user_maps (line 49)
        [heat] = plotSpotlight(im,heatmap,3);