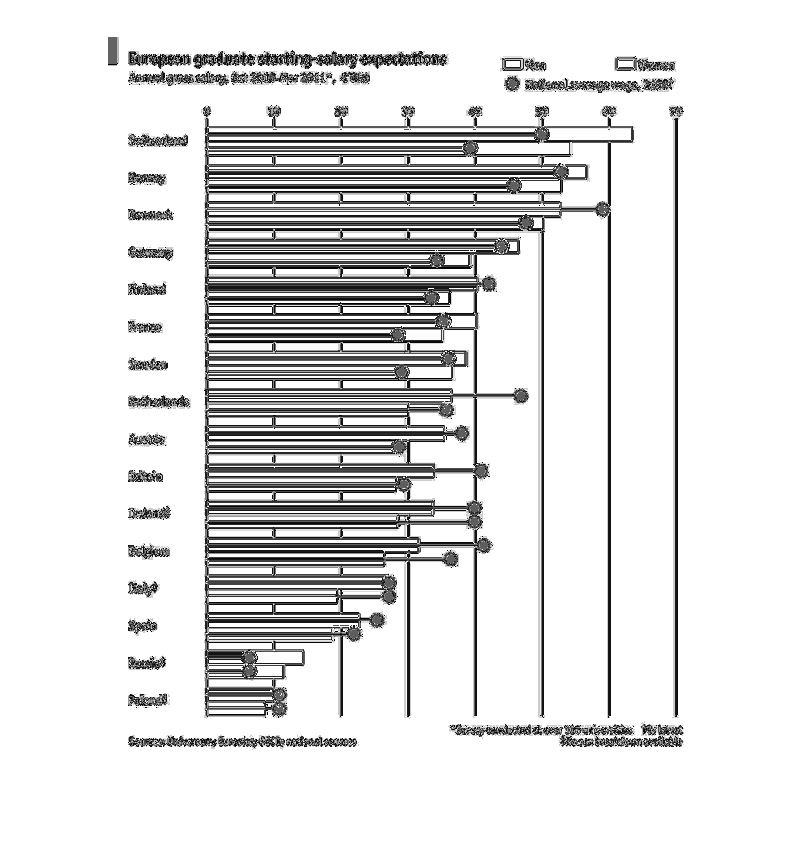
This is a dual bar graph about EU graduate starting salary expectations. Overall, women are
less than men in expectations. The graph is in order of the highest expectations of amount
of money to the lowest from top to bottom, respectively. Usually, the national average wage
is lower than expectations.
Error using .*
Matrix dimensions must agree.

Error in plotSpotlight (line 30)
    output = repmat(a,[1 1 3]).*single(im)/255;

Error in plot_individual_user_maps (line 49)
        [heat] = plotSpotlight(im,heatmap,3);