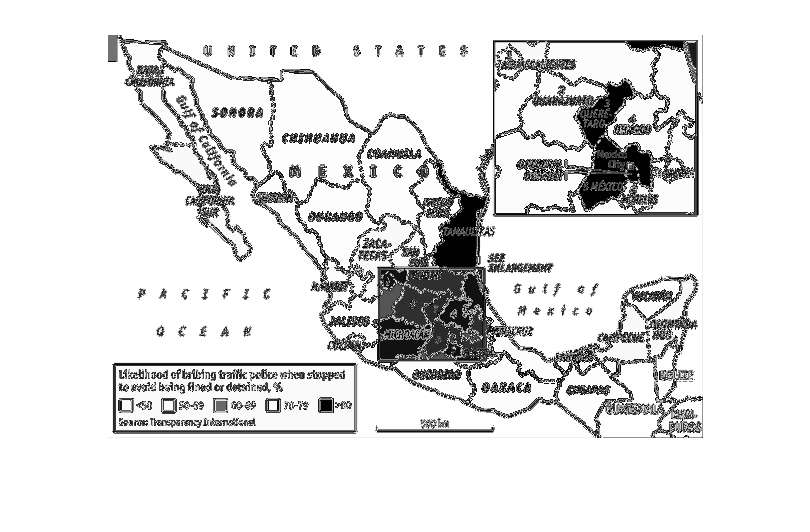
This chart describes the likelihood of bribing traffic police when stopped to avoid being
fined or detained. Percentages are represented on the chart by different colors.
Error using .*
Matrix dimensions must agree.

Error in plotSpotlight (line 30)
    output = repmat(a,[1 1 3]).*single(im)/255;

Error in plot_individual_user_maps (line 49)
        [heat] = plotSpotlight(im,heatmap,3);