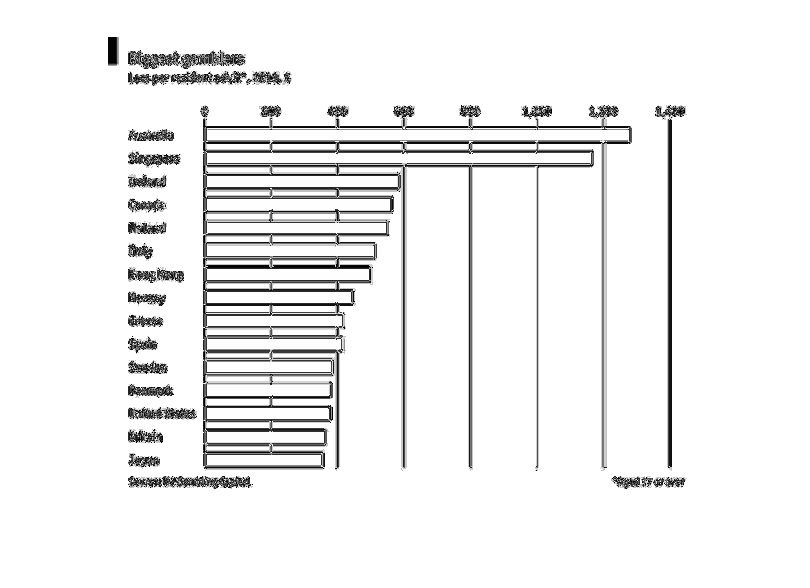
This chart gives us a look at the biggest gamblers, based on losses from adults. Data is from
2010. The graph has it broken down by country on a scale of 0 to 1400 dollars and is listed
inversely, with the country with the most average losses from gambling on top to the lowest
on bottom.
Error using .*
Matrix dimensions must agree.

Error in plotSpotlight (line 30)
    output = repmat(a,[1 1 3]).*single(im)/255;

Error in plot_individual_user_maps (line 49)
        [heat] = plotSpotlight(im,heatmap,3);