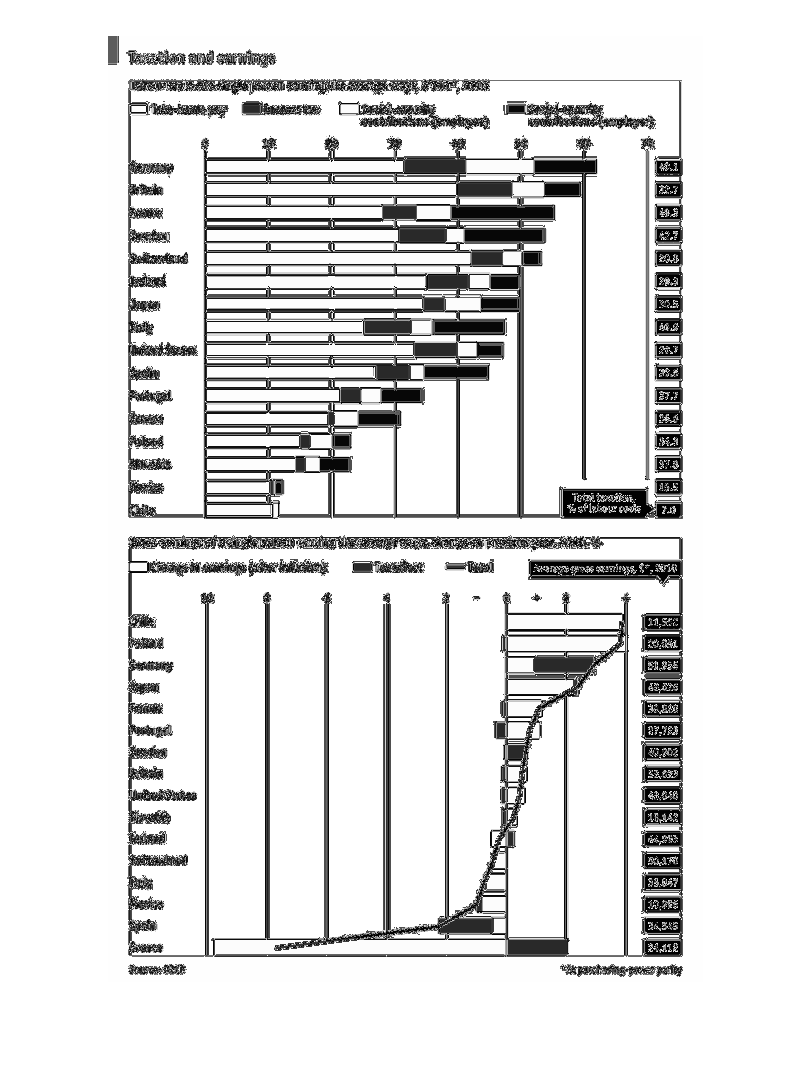
The top graph shows how much of an average wage worker's salary is kept, goes towards income
tax, social security (employee) and social security (employer) in various countries. The bottom
graph shows the percentage change in gross wage from the previous year for the average person
in different countries.
Error using .*
Matrix dimensions must agree.

Error in plotSpotlight (line 30)
    output = repmat(a,[1 1 3]).*single(im)/255;

Error in plot_individual_user_maps (line 49)
        [heat] = plotSpotlight(im,heatmap,3);