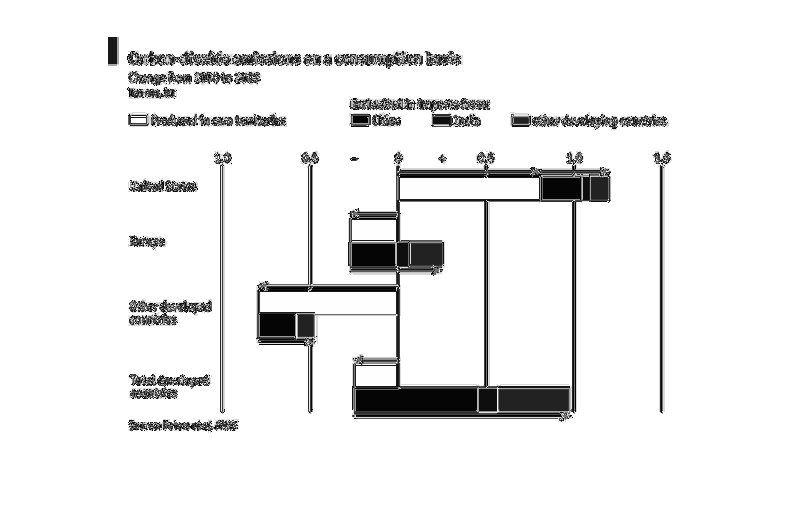
This chart is about carbon dioxide on a consumption basis. It is showing what countries produce
the most. Looks like China is at the top of this chart too and other developed countries are
down at the bottom.
Error using .*
Matrix dimensions must agree.

Error in plotSpotlight (line 30)
    output = repmat(a,[1 1 3]).*single(im)/255;

Error in plot_individual_user_maps (line 49)
        [heat] = plotSpotlight(im,heatmap,3);