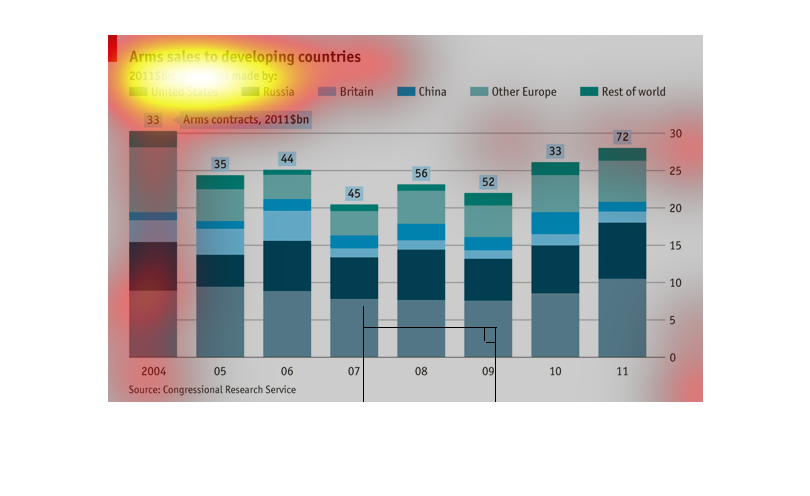
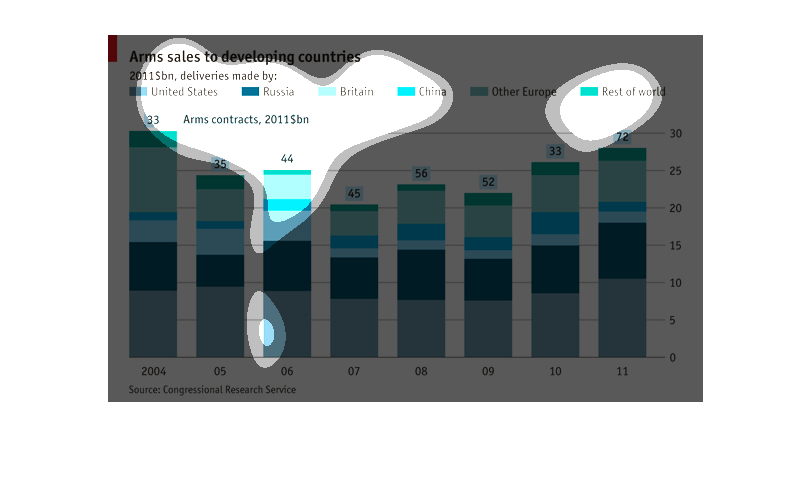
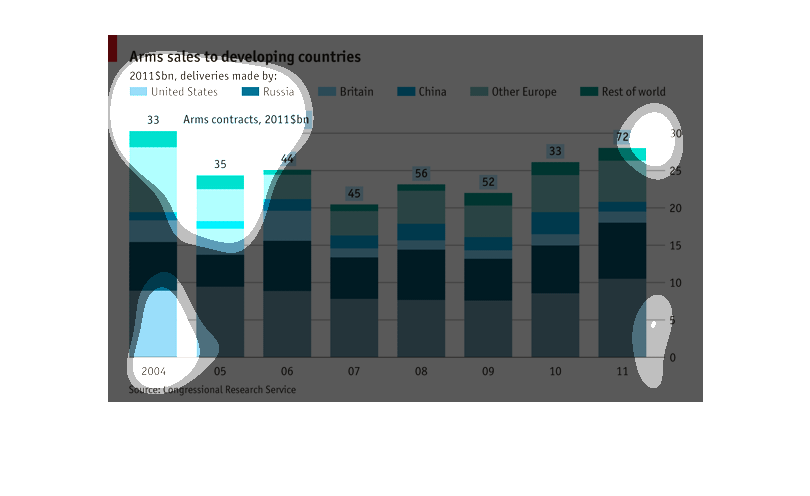
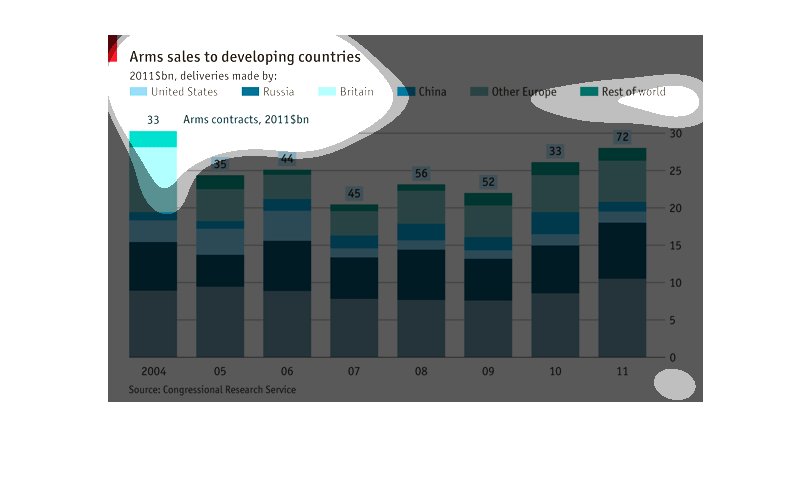
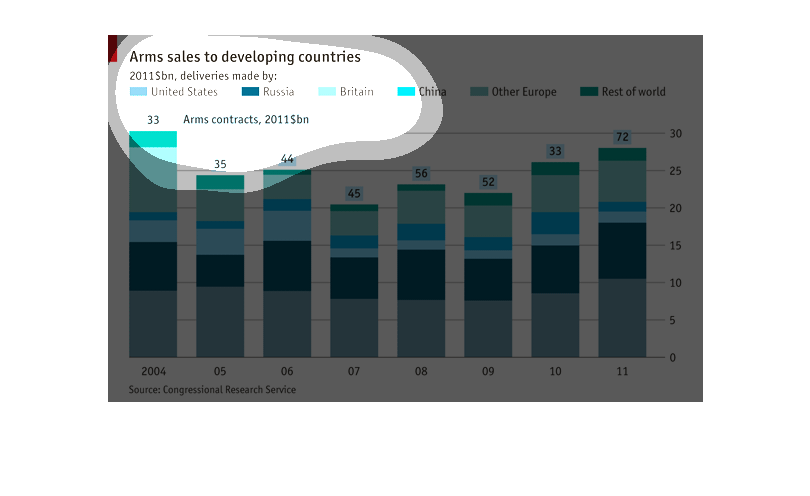
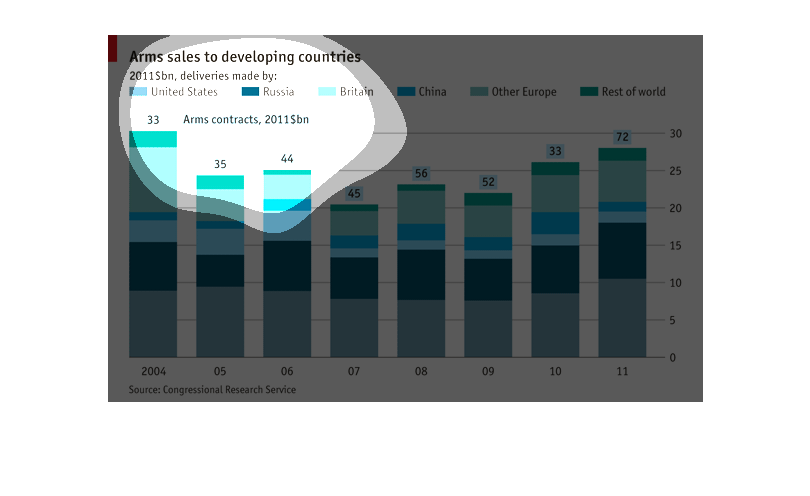
This bar graph shows us arms sales to developing countries by the United States, Russia, Britain,
China, other European countries, and the rest of the world from 2004 to 2011.
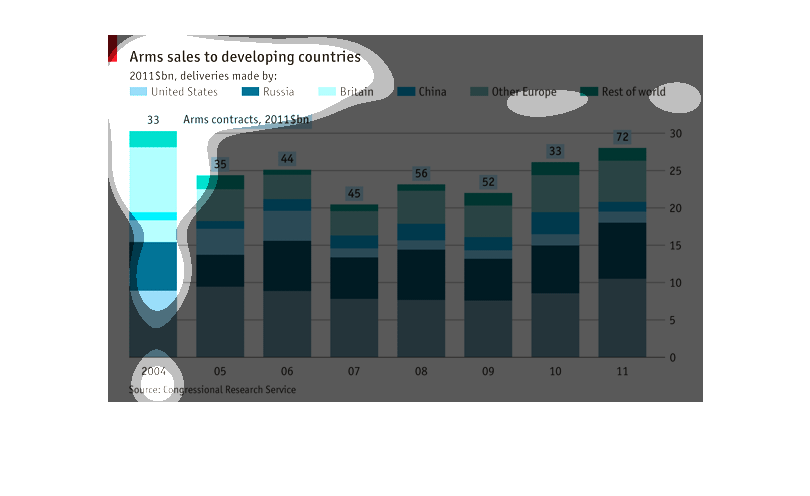
This graph shows the amount of arms exports to developing nations between the years of 2004
and 2011. The graph is divided by which countries or regions are doing the exporting. The
data indicates that a plurality of the exports come from the United States, with Russia being
second in exports.
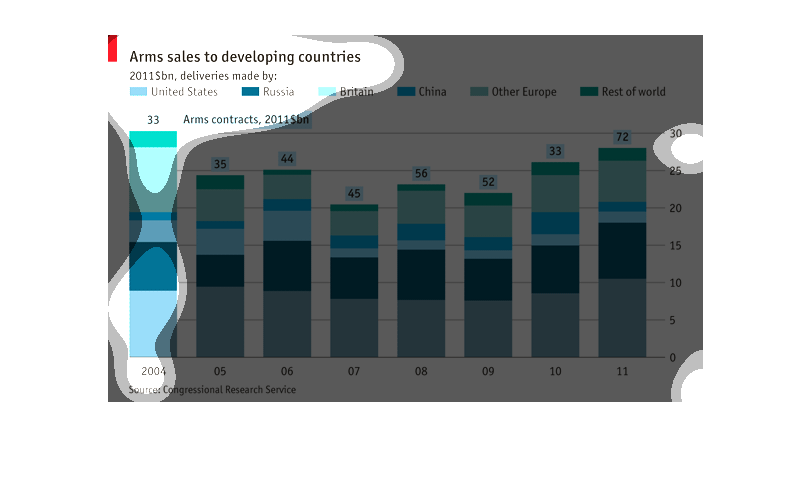
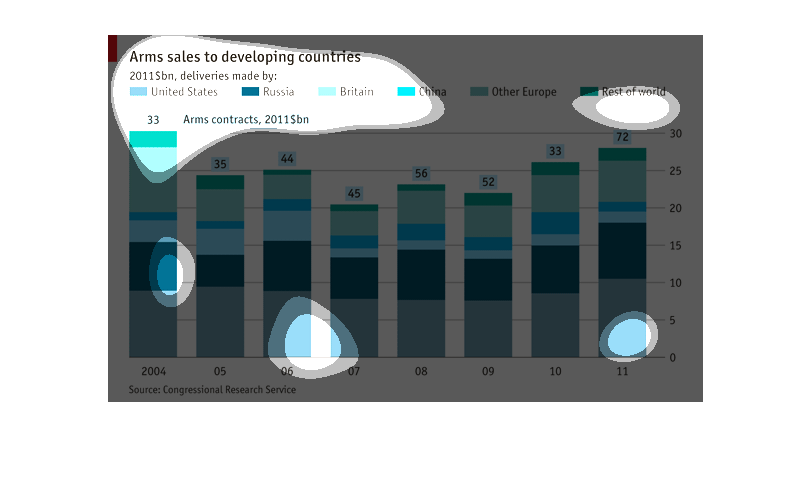
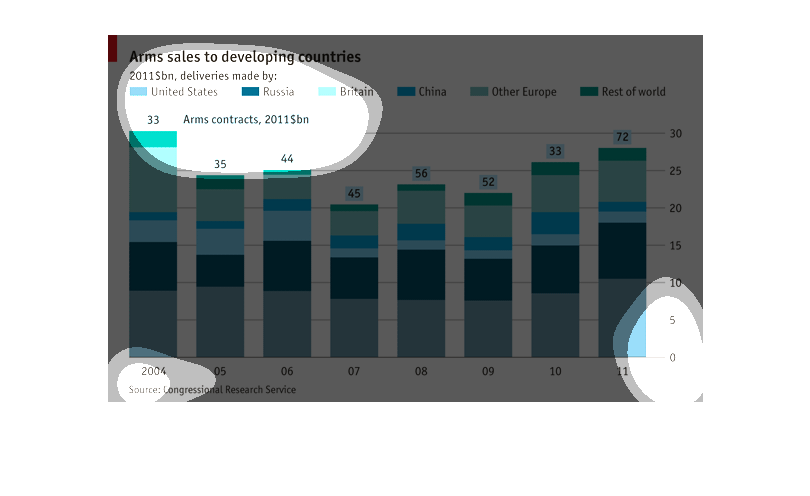
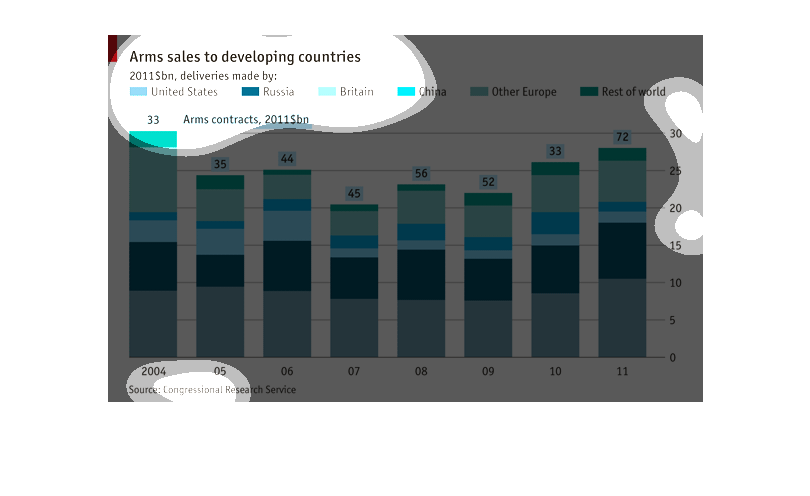
This is a blurry picture of a graph.  It is very hard to read, but the graph and chart is
blue, and appears to be some sort of sales chart.  It has a lot of different countries listed
on it including the United States, Russia, Britain, and China.
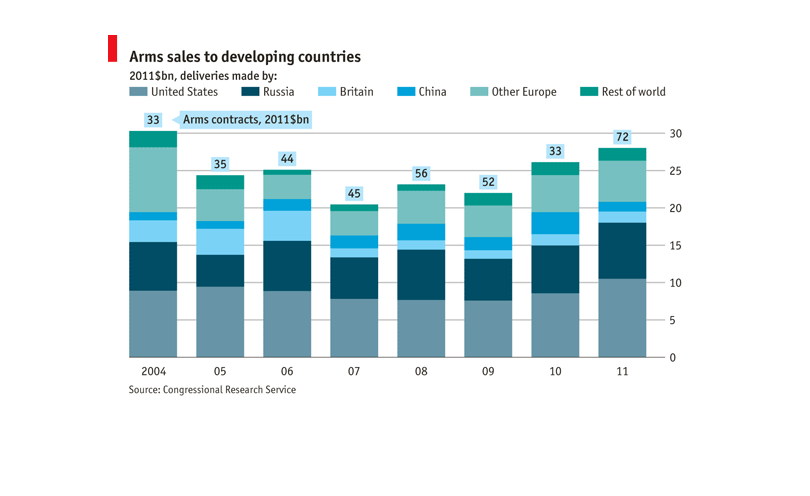
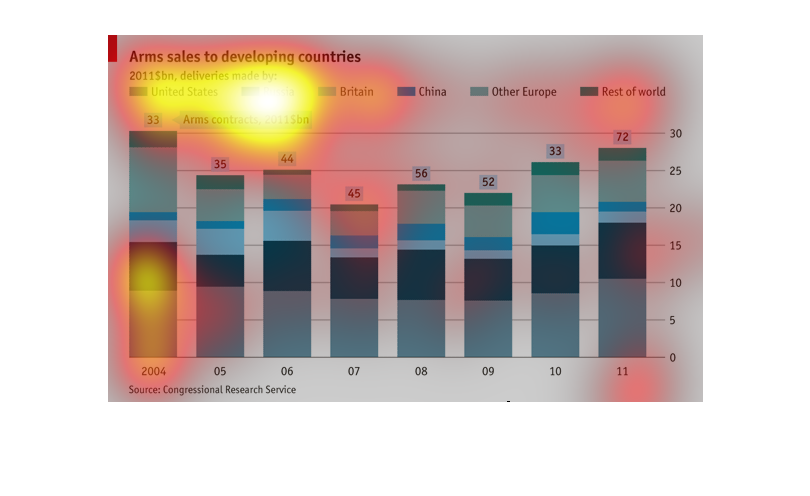
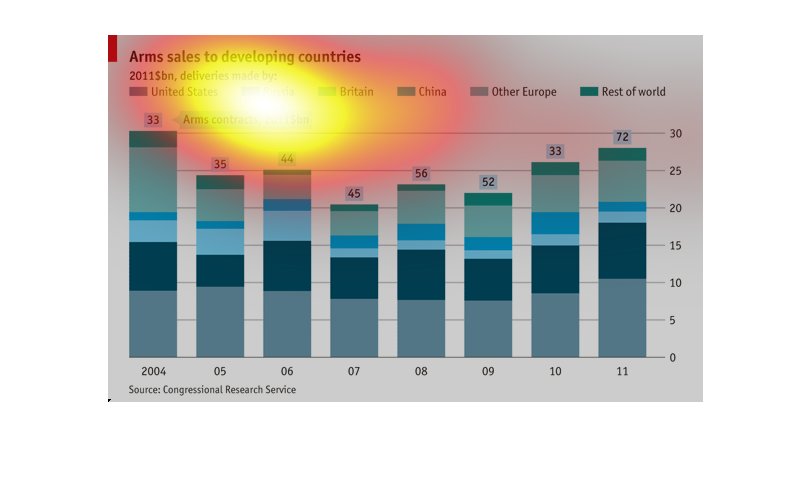
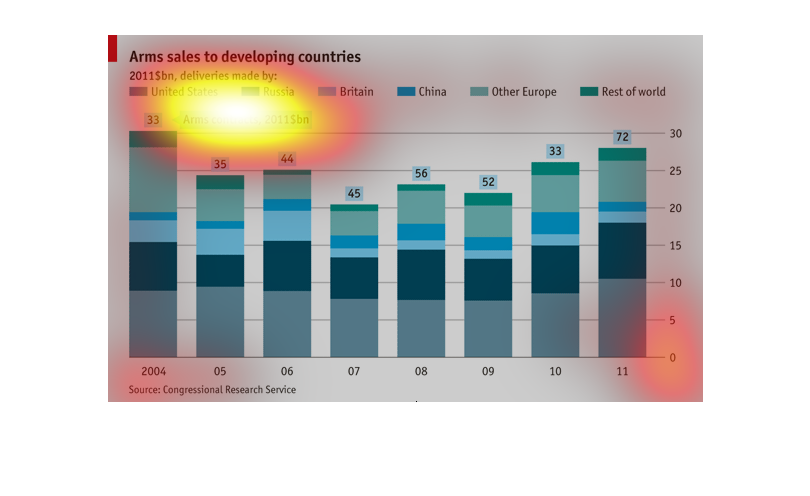
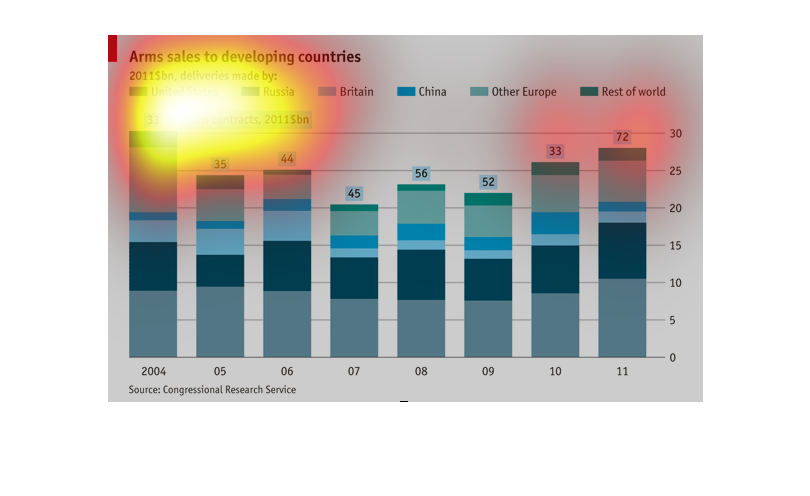
This graph describes arm sales to developing countries. Showing deliveries made by the US,
Russia, Britain, China, Europe, and the rest of the world. The US appears to make the most
deliveries of arms sales.
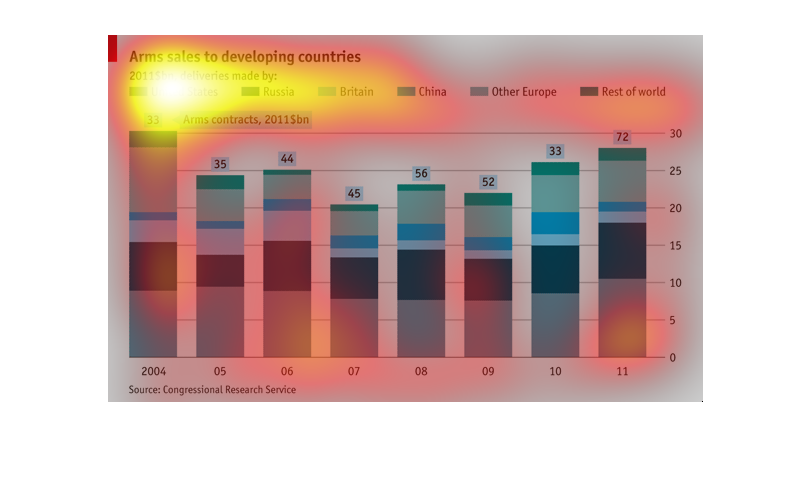
Arm sales to developing countries. It shows who is selling the most guns by country through
2004 to 2011. An overall increase in sales through the years.
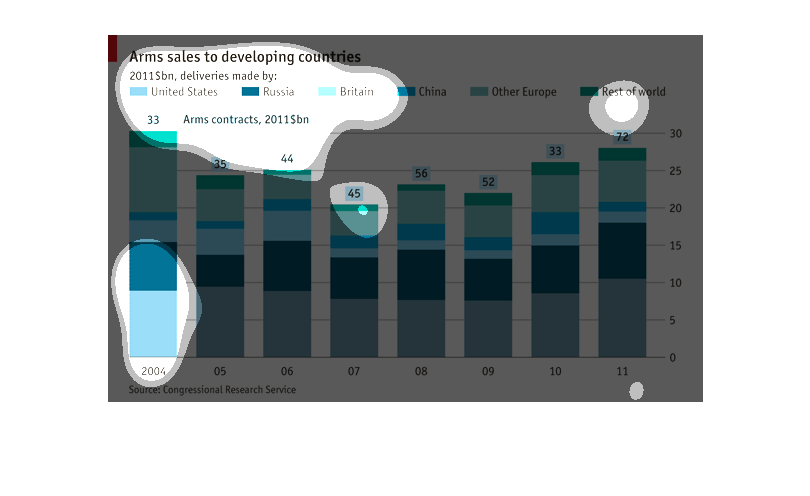
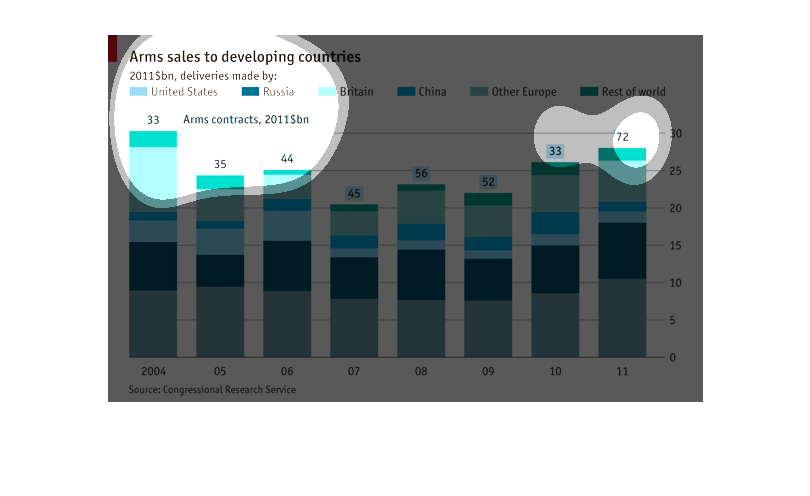
This chart describes arms sales to developing countries in the billions for the year 2011.
The chart list arms deliveries made by the United States and Britain.
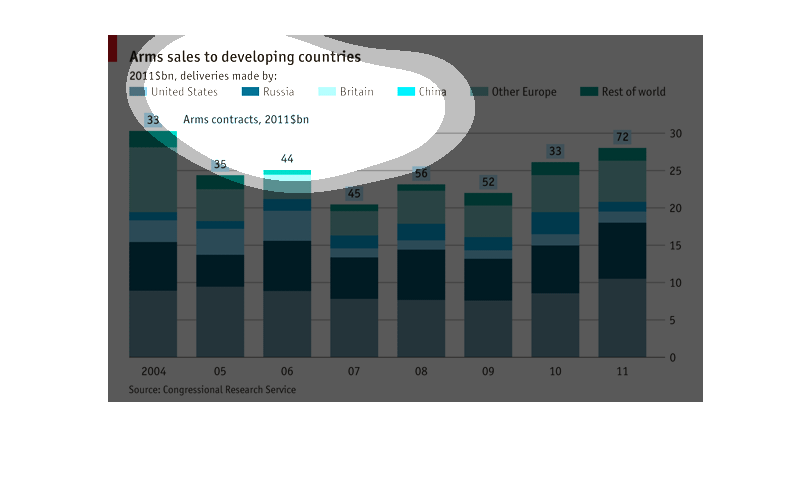
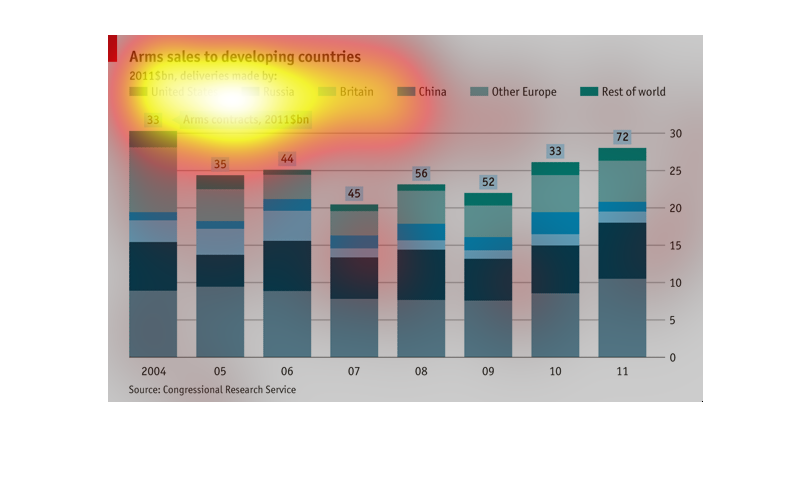
This chart is showing arms sales to developing countries from US, Russia, Britain, China,
other European countries and the rest of the world. The chart show the sales from 2004 to
2011, with highs in 2004, and 2011.
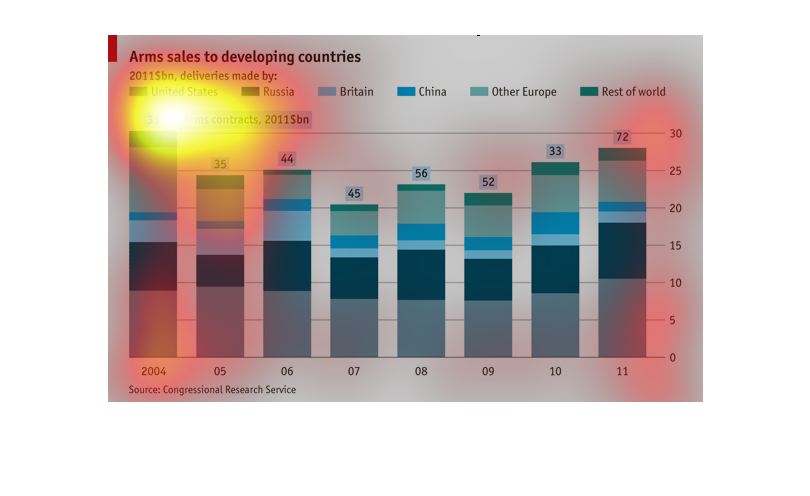
This chart depicts the total number of arms contracts in the world between 2004 and 2011.
Each colored segment in  each line represents a different country at which arms contracts
were made for. The USA and Russia are the largest in regards to the number of arms contracts
made.
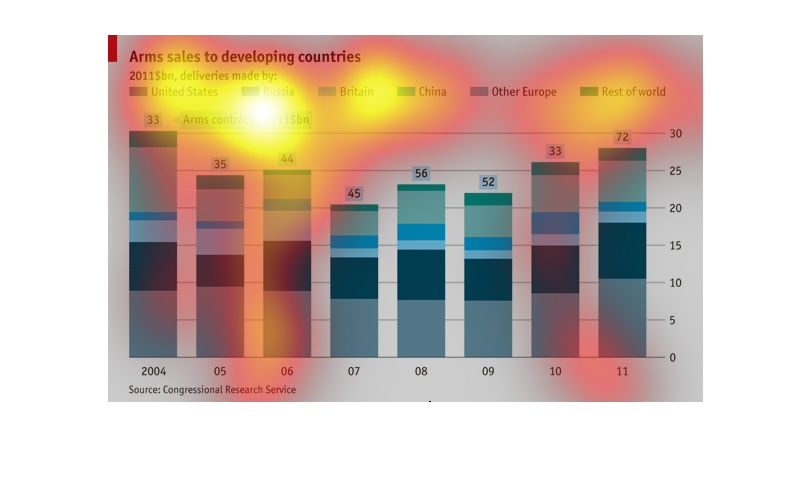
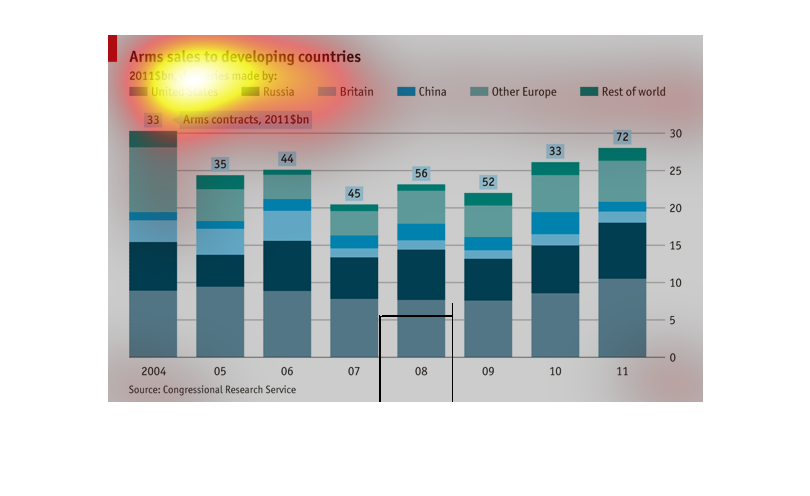
This image shows in statistical bar graph format Arms sales to developing countries by other
countries like The United States, Russia, Britain and China.
This chart clearly describes the arms sales to developing countries. The countries include
United States, Russia, Britain, and China. There are also other countries included in the
groups other Europe, and Rest of world.
This is a chart of arm sales to developing countries deliveries made by United States, Russia,
Britain, China, Other Europe, and Rest of the World.It is a blue and green chart.
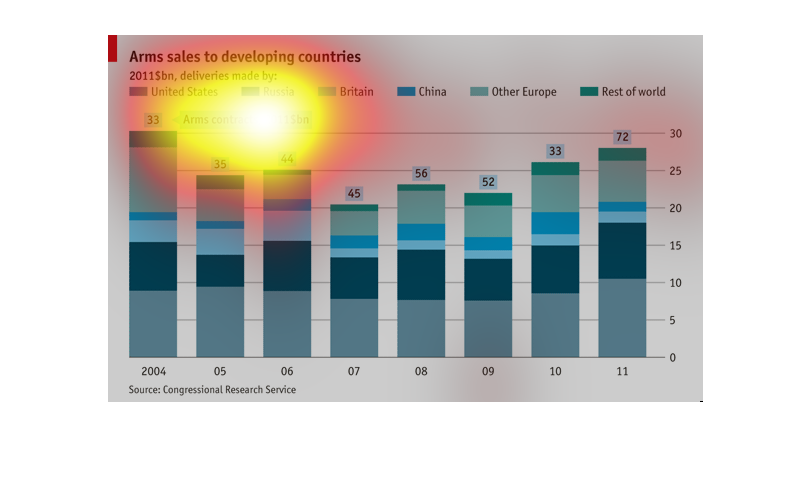
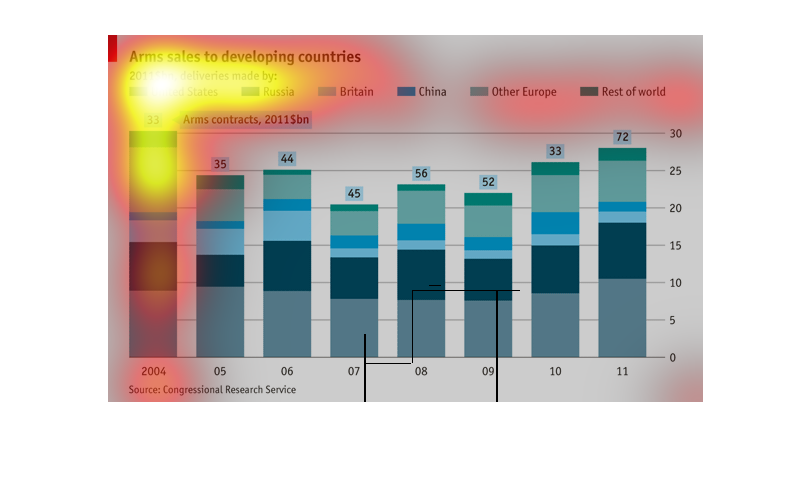
THIS STACKED BAR CHART SHOWS THE DELIVERY OF ARMS IN DOLLARS TO DEVELOPING COUNTRIES BY THE
REST OF THE WORLD. THE BARS STACK AND ARE COMPRISED OF SALES FROM OTHER COUNTIRES BY COLOR.

This graph shows a 2004-2011  colored breakdown of arms sales to developing countries, broken
out into different world nations, ranked in the billions of dollars.