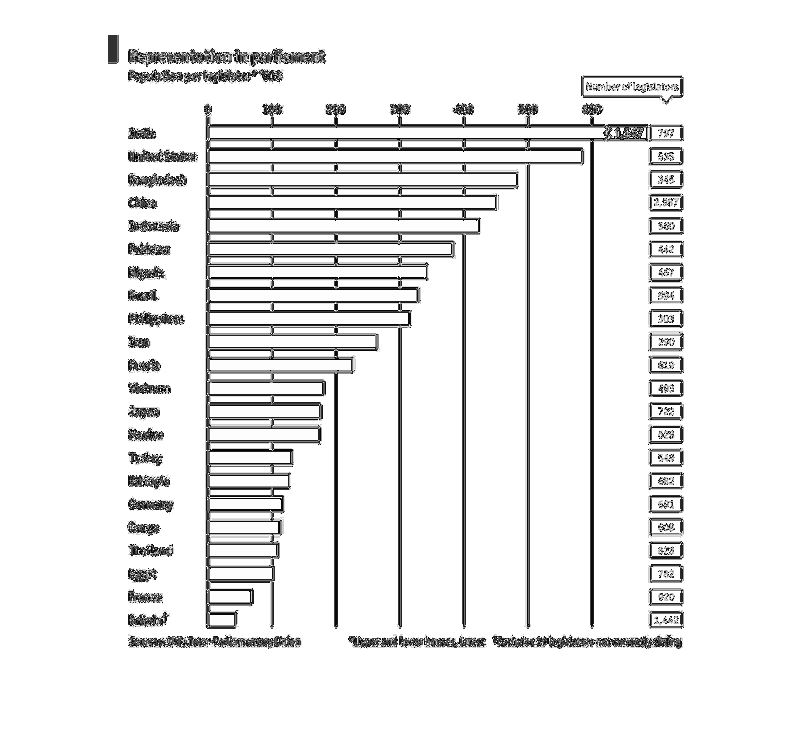
This graph shows the representation of government in terms of how many legislators per thousand
people there are living in the country. India and the United States top this chart with Britain
having the least legislative representation per 1000 people.
Error using .*
Matrix dimensions must agree.

Error in plotSpotlight (line 30)
    output = repmat(a,[1 1 3]).*single(im)/255;

Error in plot_individual_user_maps (line 49)
        [heat] = plotSpotlight(im,heatmap,3);