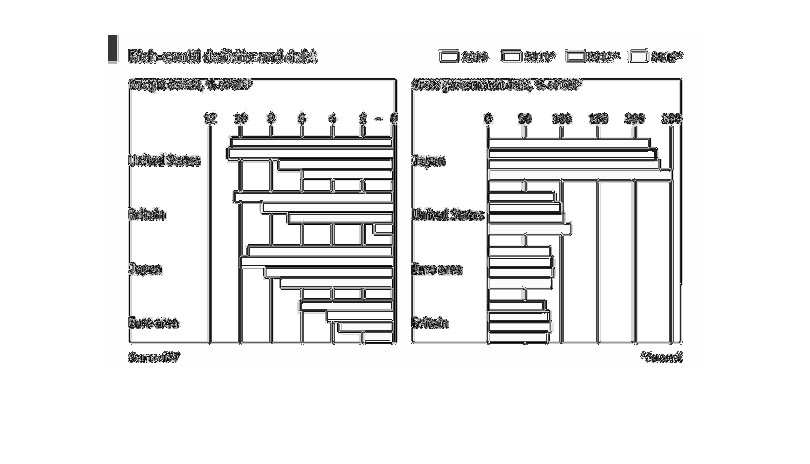
The two bar charts some the deficit in the budget and gross government debt of the United
States, Japan, "Euro Area", and Britain.  Each country has four different colored bars by
it, representing 2010 and a forecast for the years 2011, 2012 and 2016.  UNited States leads
the way in budge deficit percentage, while Japan is on top for gross government debt.
Error using .*
Matrix dimensions must agree.

Error in plotSpotlight (line 30)
    output = repmat(a,[1 1 3]).*single(im)/255;

Error in plot_individual_user_maps (line 49)
        [heat] = plotSpotlight(im,heatmap,3);