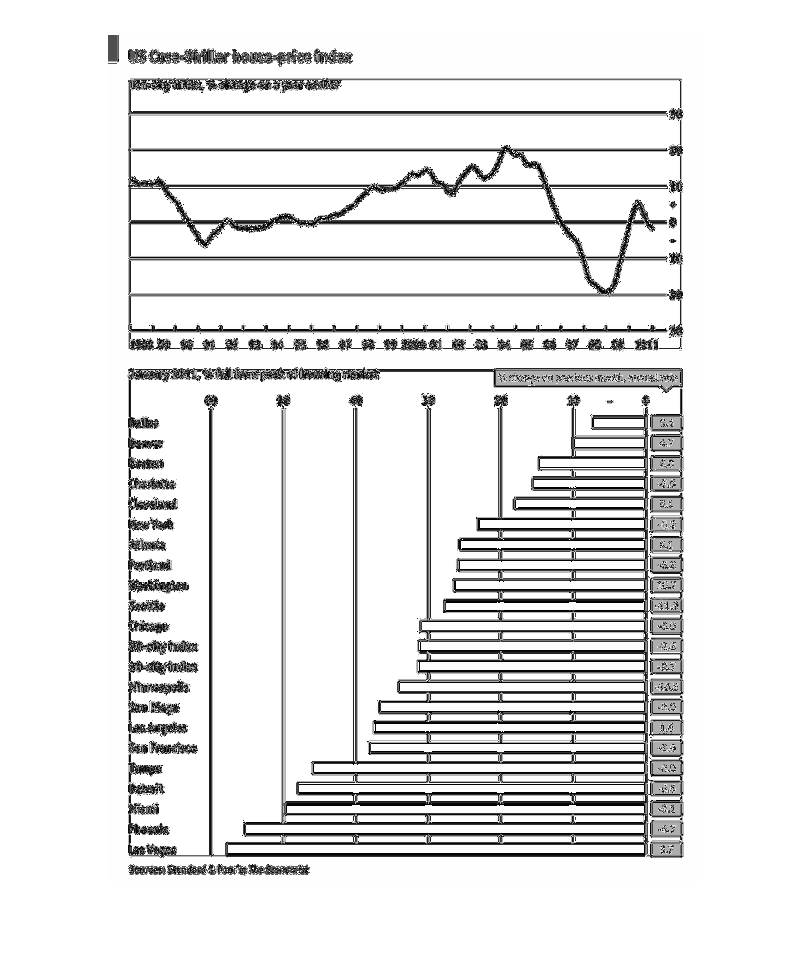
This chart describes the US Case-Schiller house-price index. It is small and hard to read,
but it list different cities and shows a graph of how the different home prices vary across
the country by city.
Error using .*
Matrix dimensions must agree.

Error in plotSpotlight (line 30)
    output = repmat(a,[1 1 3]).*single(im)/255;

Error in plot_individual_user_maps (line 49)
        [heat] = plotSpotlight(im,heatmap,3);