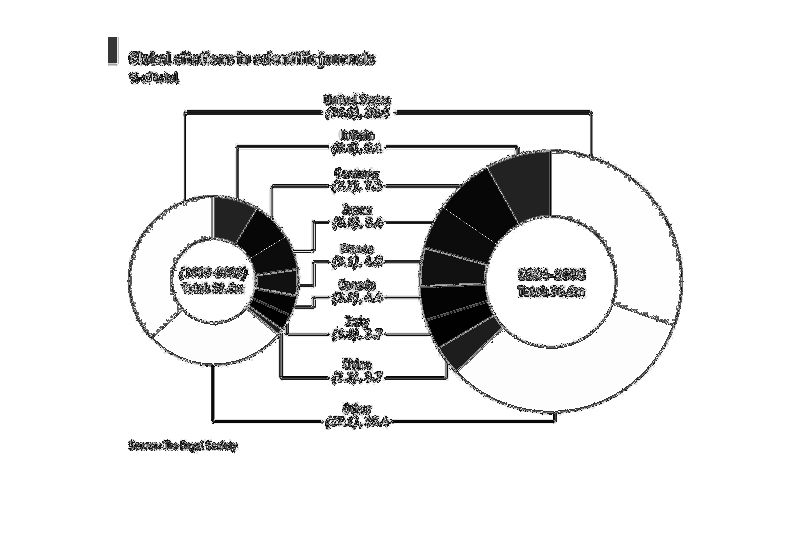
These two pie charts show how often certain countries are cited globally. The light blue is
for the United States, dark blue for Britain, gray for Germany, green for France, tan for
Canada, brown for Italy, red for China, and other for gray.
Error using .*
Matrix dimensions must agree.

Error in plotSpotlight (line 30)
    output = repmat(a,[1 1 3]).*single(im)/255;

Error in plot_individual_user_maps (line 49)
        [heat] = plotSpotlight(im,heatmap,3);