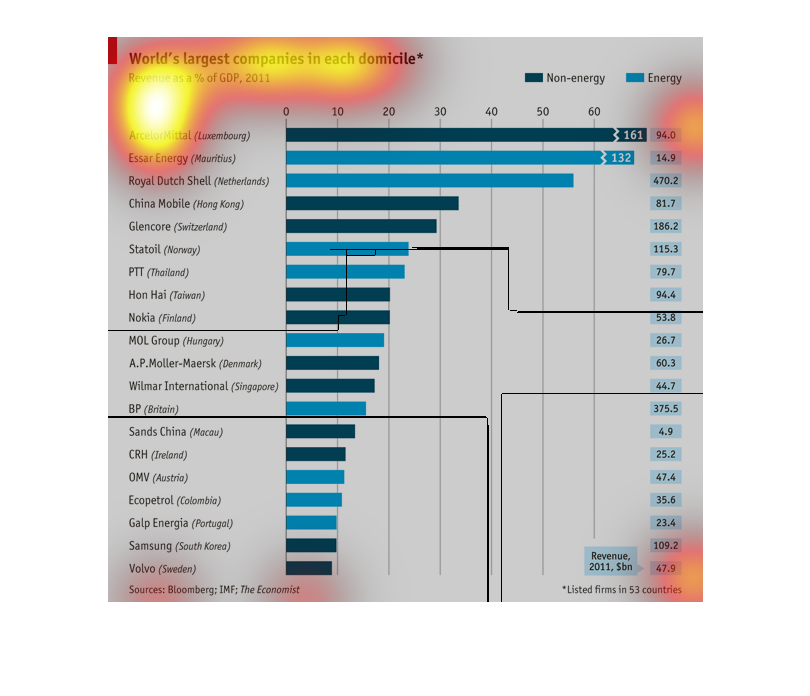
Bar chart showing companies with the highest revenues in percentage of GDP in each domicile,
organized from highest. Companies are categorized as energy or non-energy.
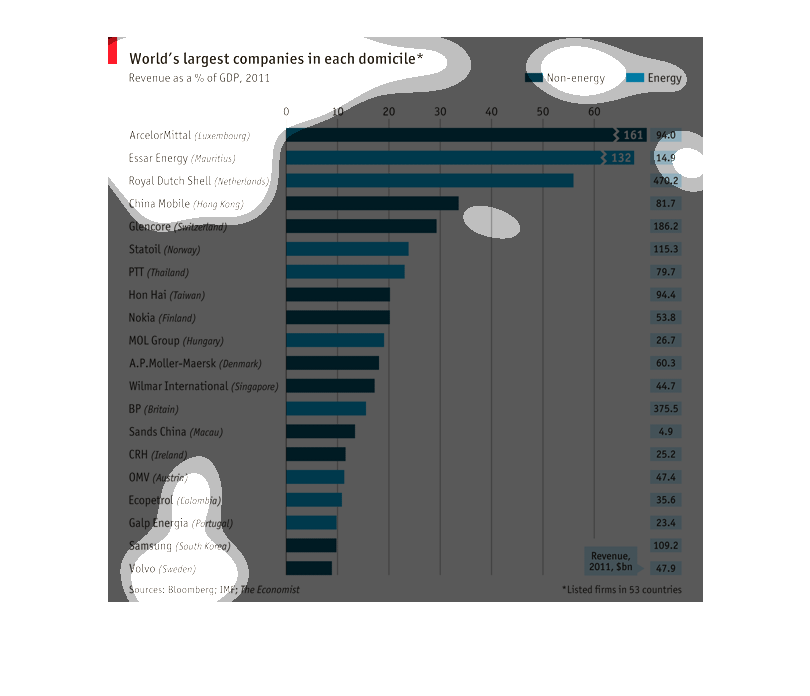
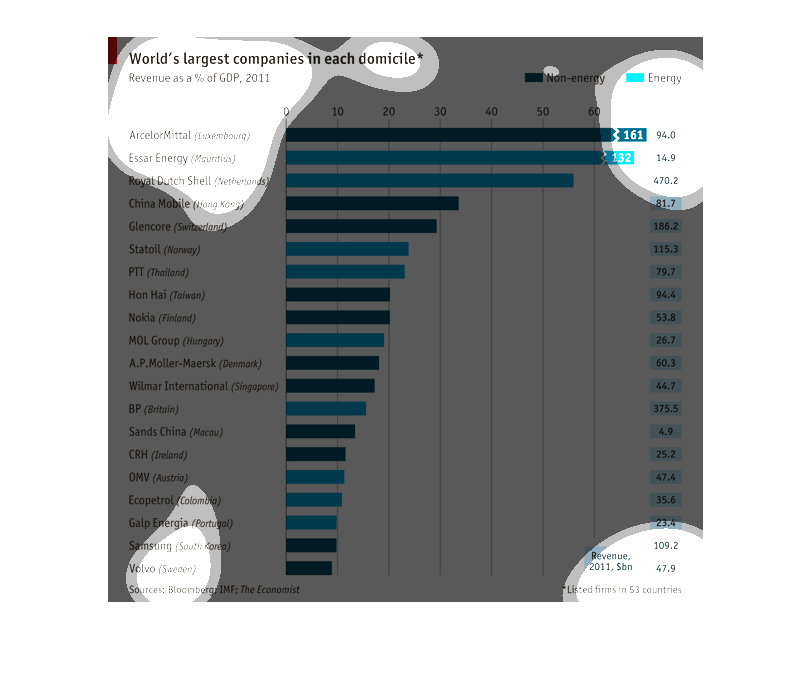
The image depicts a bar graph comparing the worlds largest energy and non-energy companies
by domicile.  It appeared in The Economist and was compiled by Bloomberg.
This graph shows world's largest companies in each domicile in 2011 for both energy and non-energy
categories.  Accelor Mital and Essar Energy are at the top of the list.
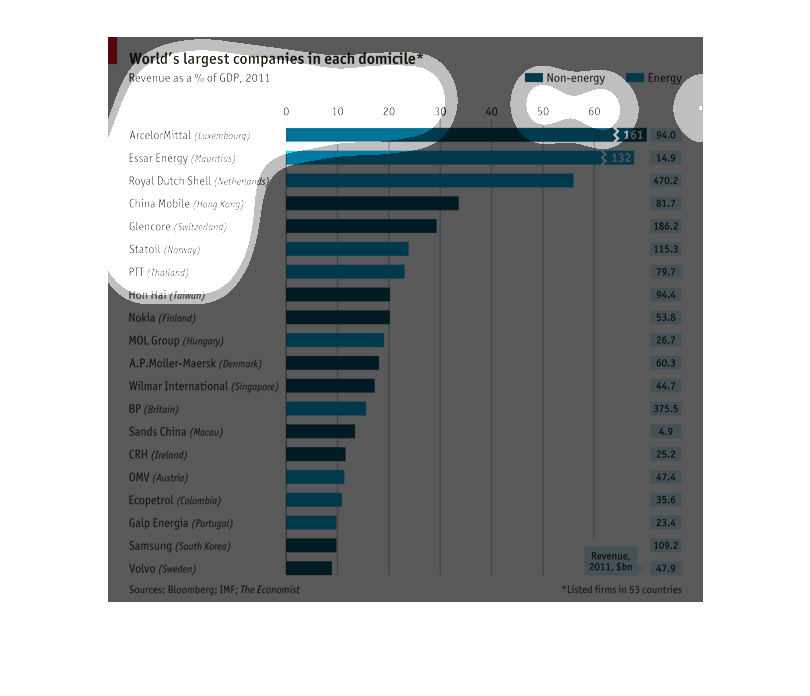
This is a graph of the worlds largest companies ranked by different avenues, in revenue as
a % of GDP. Colored coded by energy and non energy domiciles.

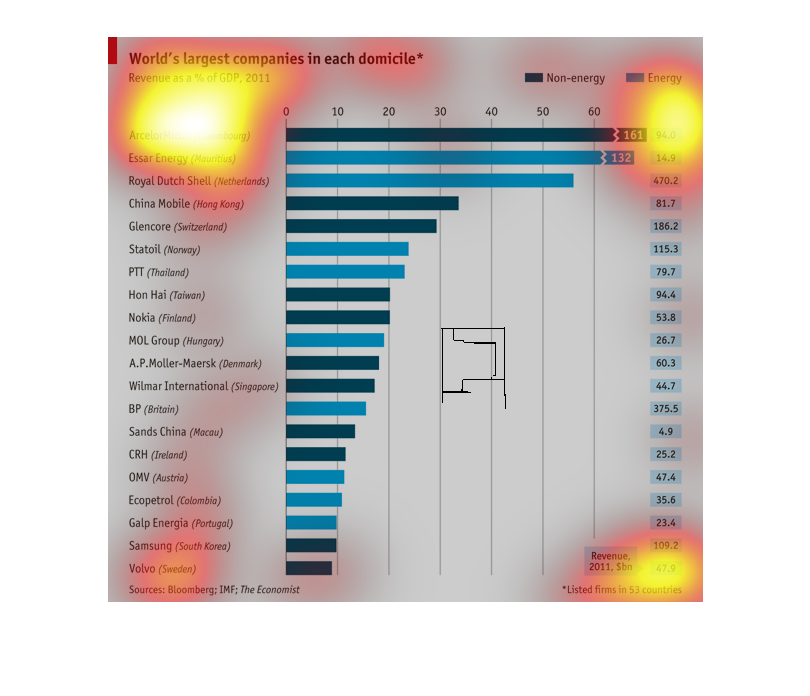
The world's largest companies in each domicile according to revenue as a percent of GDP in
2011. A disinction between energy and nonenergy companies is made. ArcelorMittal leads the
nonenergy pack and Essar leads in energy.
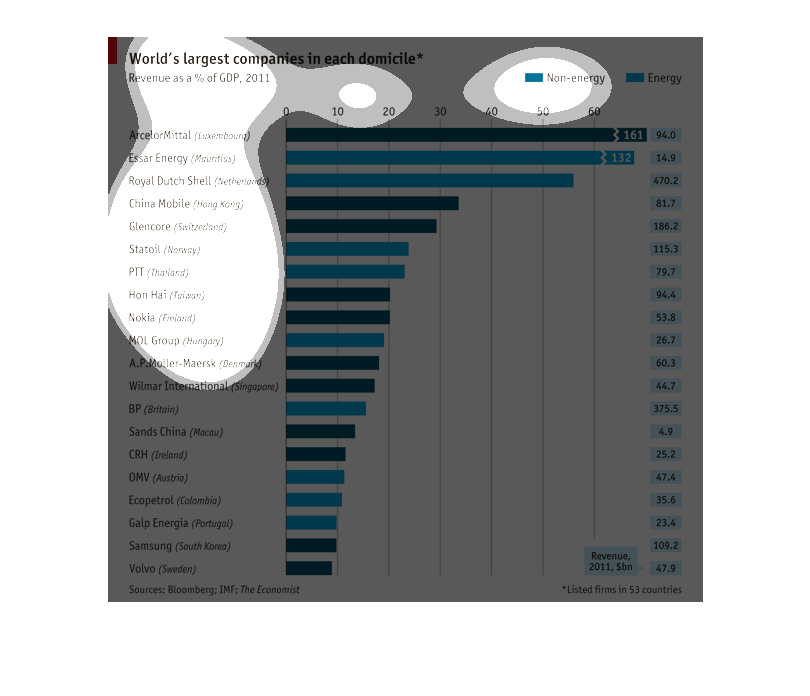
A bar chart of World's Largest Companies in each domicile, Revenue as a percentage of GDP
for 2011 Split by sectors of Energy and Non-Energy companies.
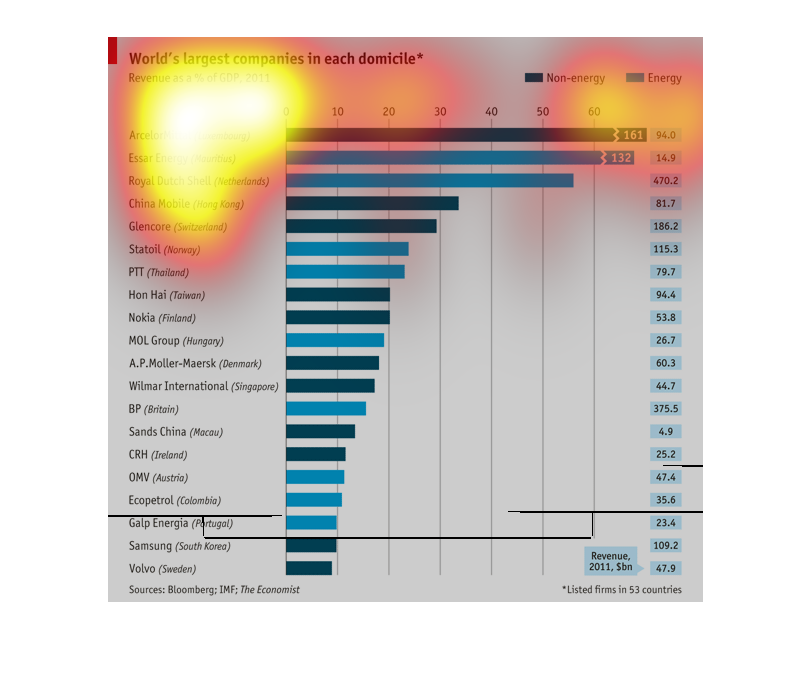
World's largest companies in each domicile. It is a graph looking at it from non-energy and
energy sources. Some of the countries are China and Thailand
This chart describes the world's largest companies in each domicile. Companies on the chart
include China Mobile, Essar Energy, and Royal Dutch Shell.
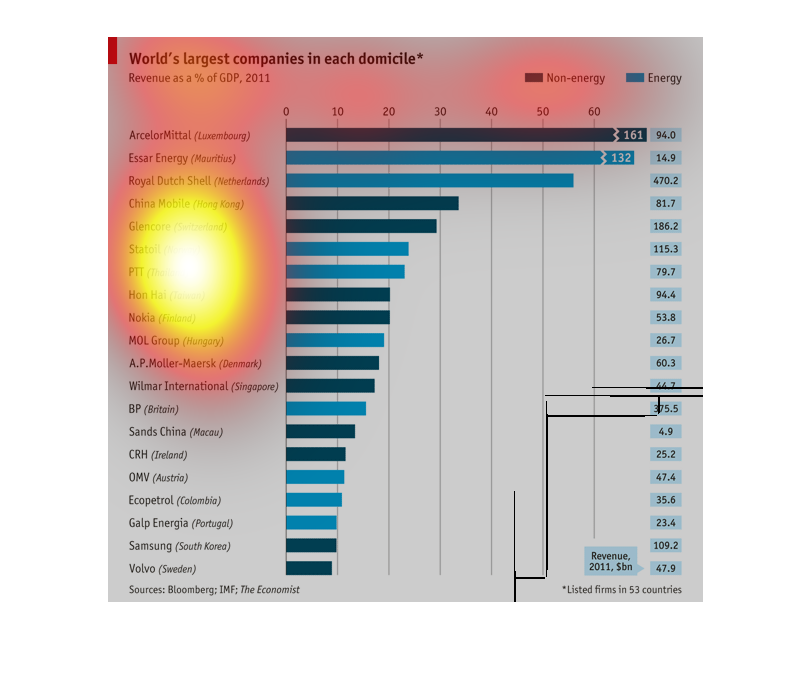
This graph describes the world's largest companies in each domicile by measuring the percentage
of revenues a company makes compared to the GDP. ArcelorMittal in Luxembourg comes in as the
company with the highest percentage of the twenty domiciles listed at 94.0%. Volvo in Sweden
comes in as the lowest recorded percentage at 47.9%
The bar chart lists the world's largest companies in various European and Asian domiciles.
It also breaks down by color the companies that are involved in energy or not.  The largest
(non energy) company is AccelorMittal from Luxemberg.
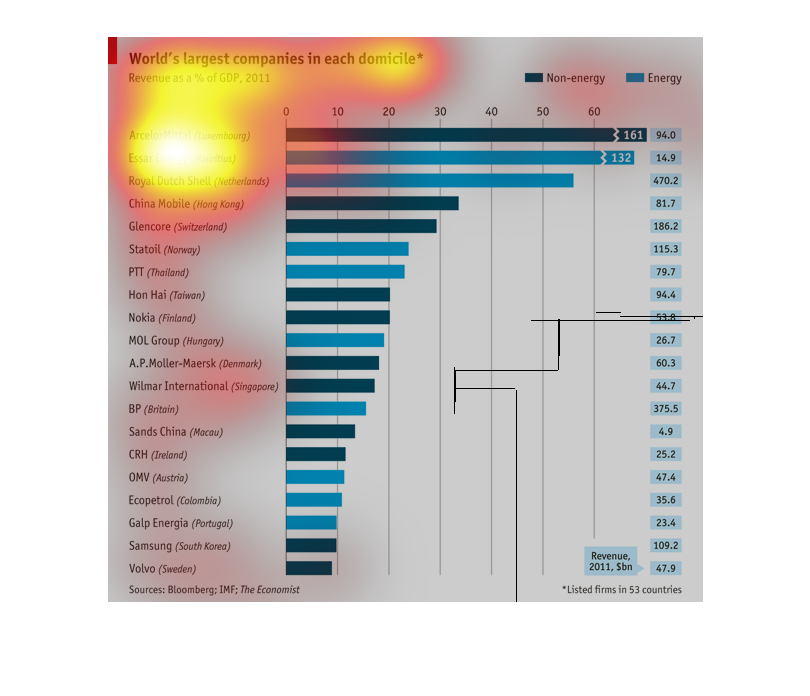
The graph shows the worlds largest companies and the countries they originate from, separating
them based off their company revenue basis (be it from energy, or not from energy)
Bar graph of the worlds largest companies by revenue as a percentage of GDP in 2011. The graph
displays a difference in color between energy and non-energy companies.
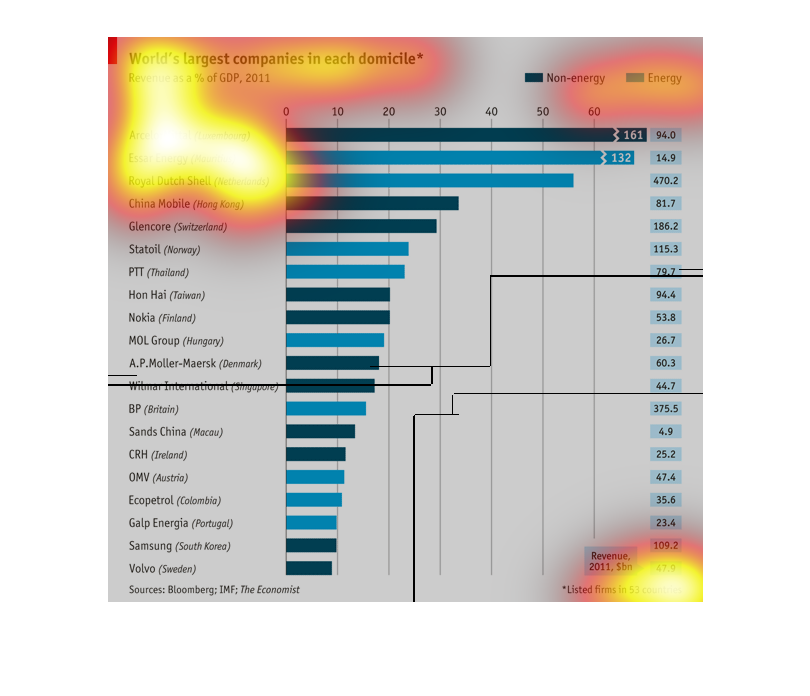
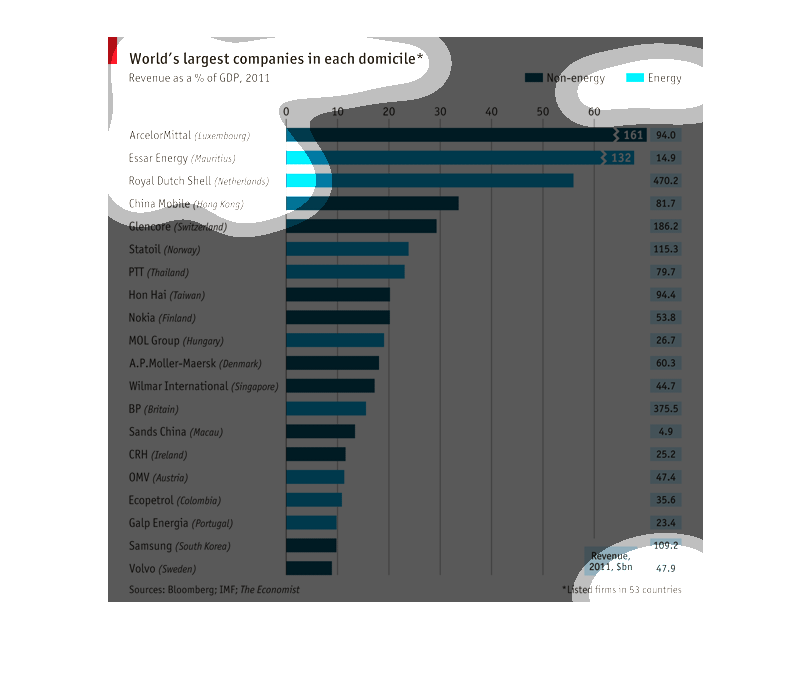
The graph lists the world's largest companies by country, in revenues by billions of dollars.
 It is broken down into energy vs. non-energy sectors, by color.
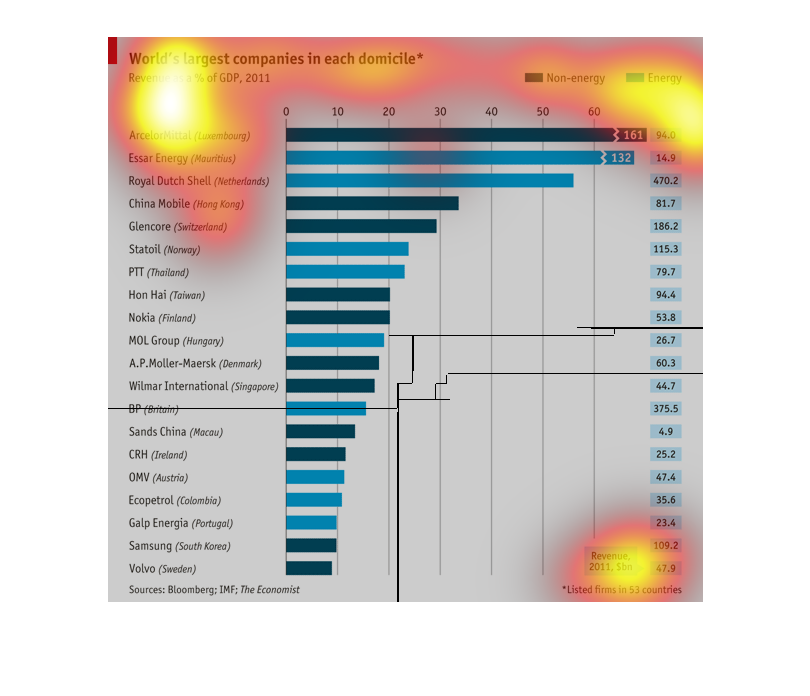
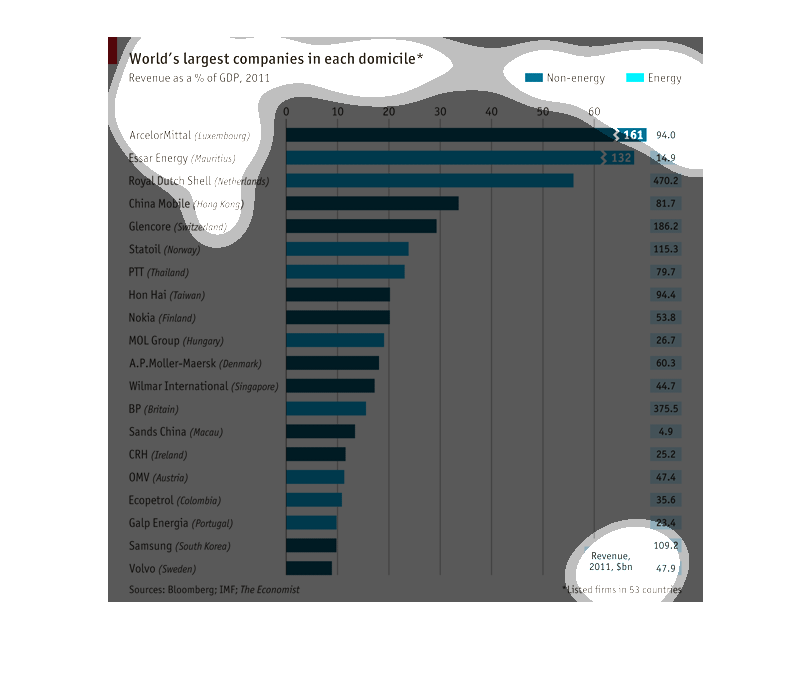
This  chart shows "The worlds largest companies in each domicile. The chart ranges from 47.9
to 94.0 and it appears to have 21 different companies listed with Arcelor Mittal at the top
at 94.0 and Volvo at the bottom.