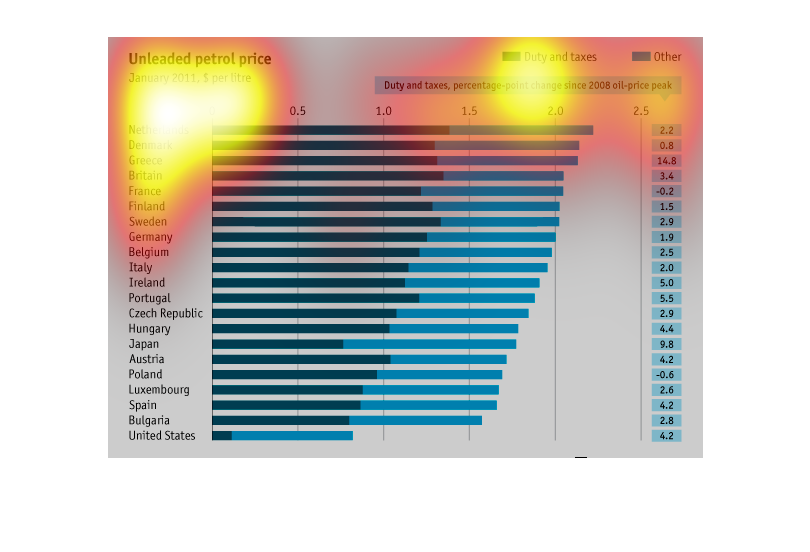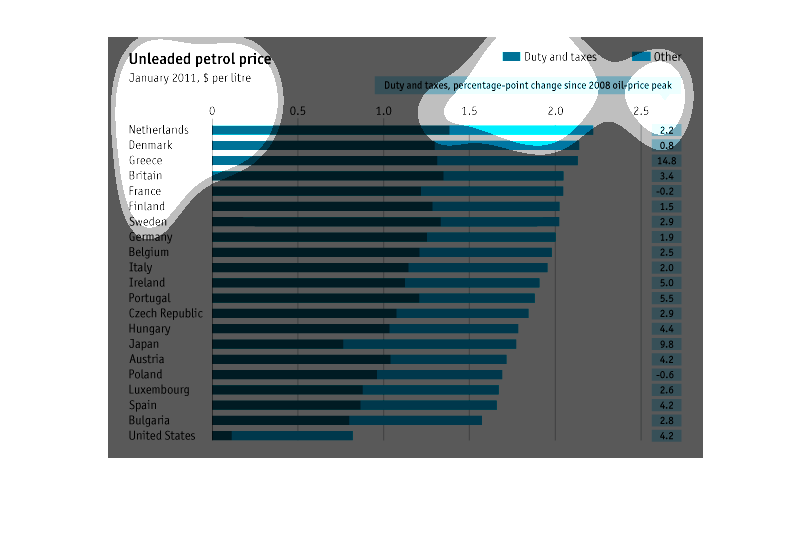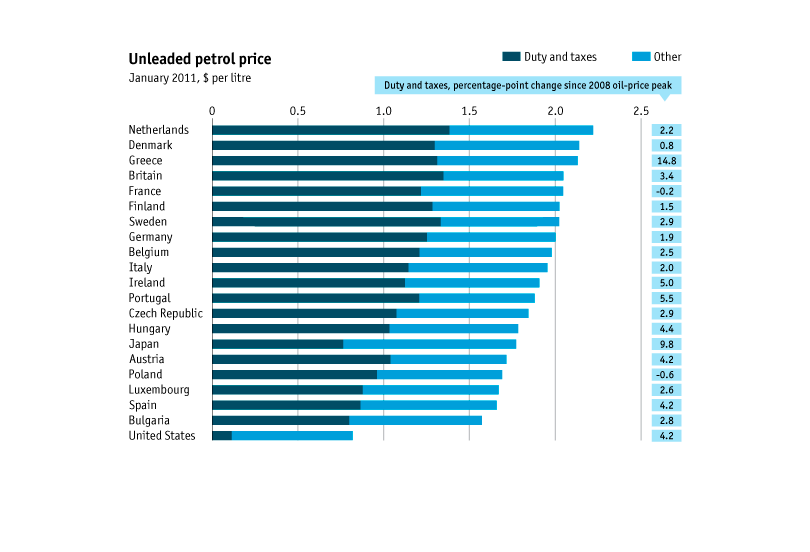
This chart graphs the unleaded petrol prices across industrialized nations.  It looks at the
price per liter and compares not only the taxes and duties, but the percent change in each
country's petrol cost since the oil price peak of 2008.

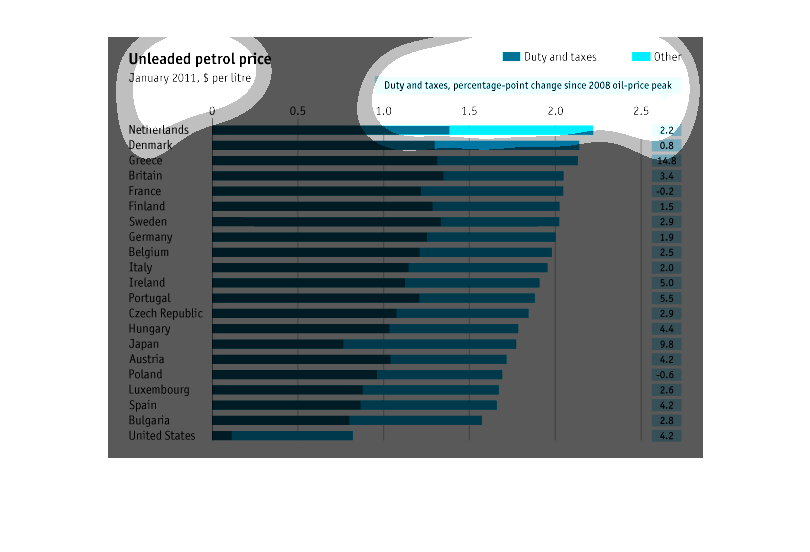
The chart shows the unleaded petrol price per litre and what the money being charges is attributed
to. They have included Duty and tax which is the majority of the price and other which consumes
overall about a third of the expense.
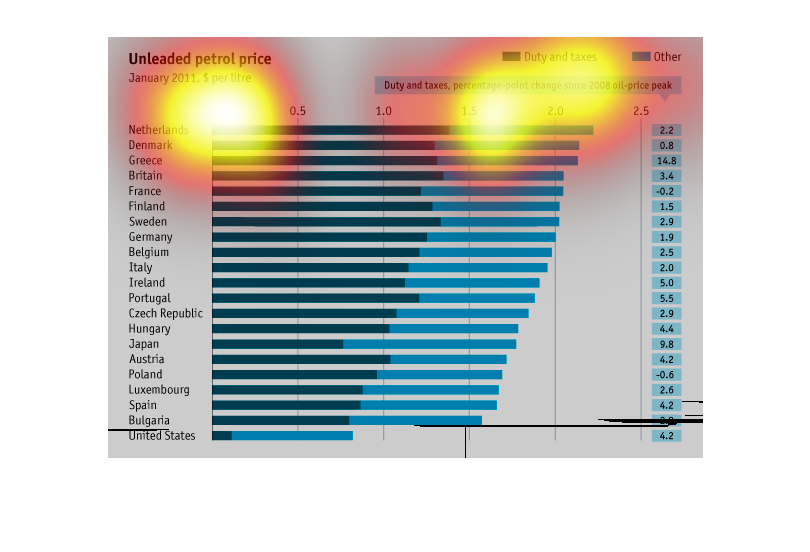

This graph describes unleaded petrol prices comparing duty and taxes vs other. The Netherlands
has the highest price of petrol and the US has the lowest. The United States also has the
lowest duty and taxes price overall. Japan also has a relatively low duty and taxes price.
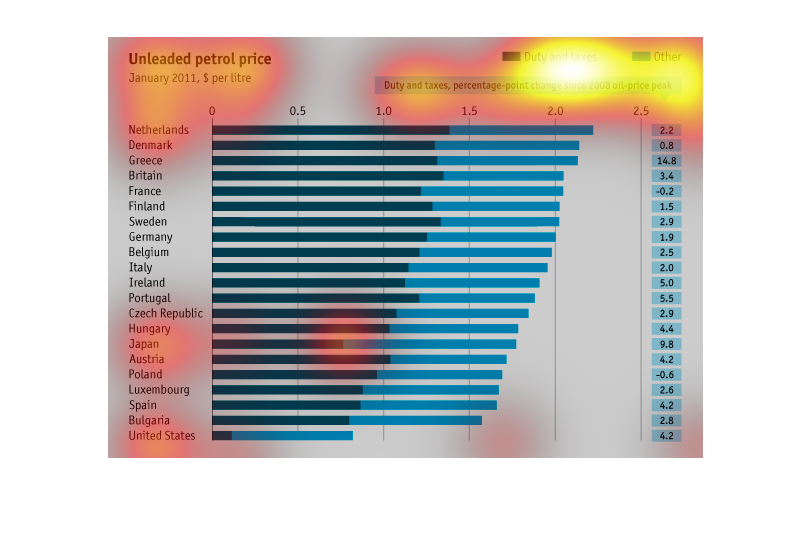
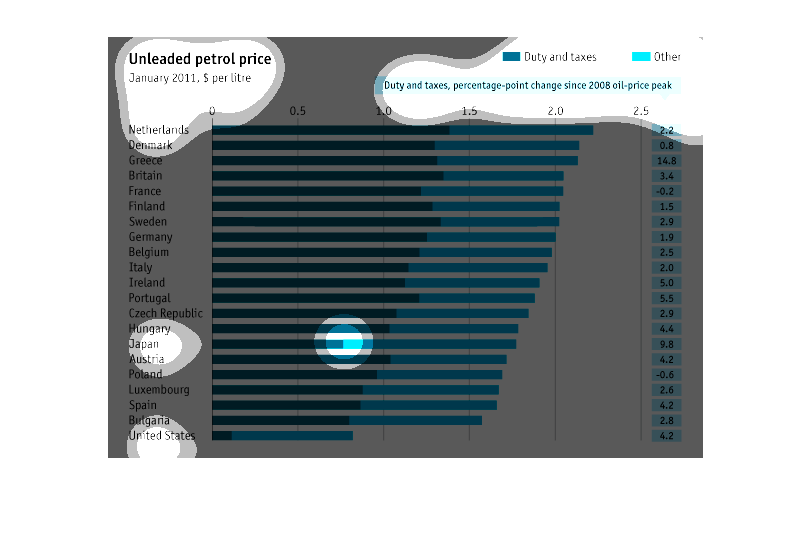
This chart describes unleaded petrol price for January of 2011. Countries on the chart include
Denmark, Greece, Britain, France, Sweden, Germany, and Belgium.
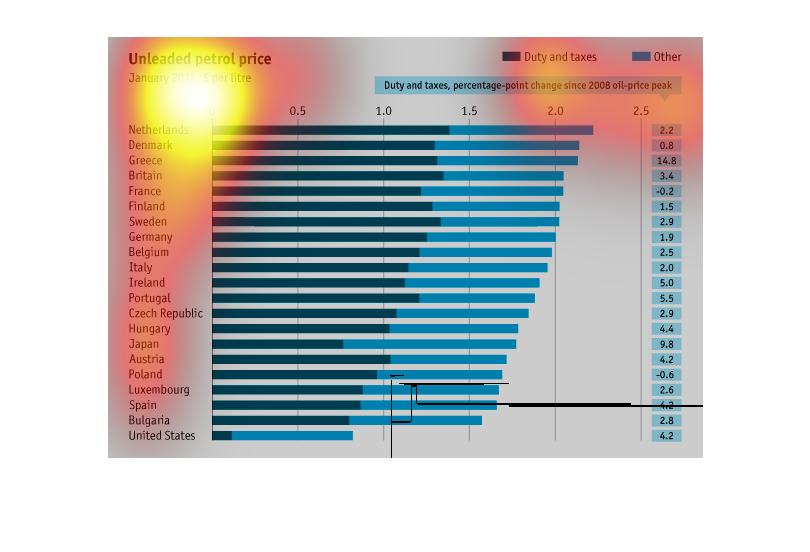
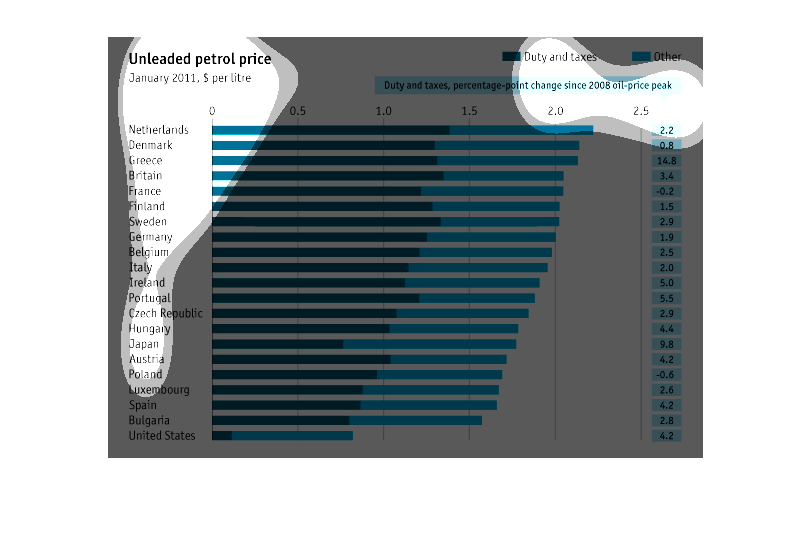
This chart shows the price per litre of unleaded petrol in January 2011. It brakes the prices
by duty and tax. In first place is Netherlands followed by Denmark and taking last place is
the United States
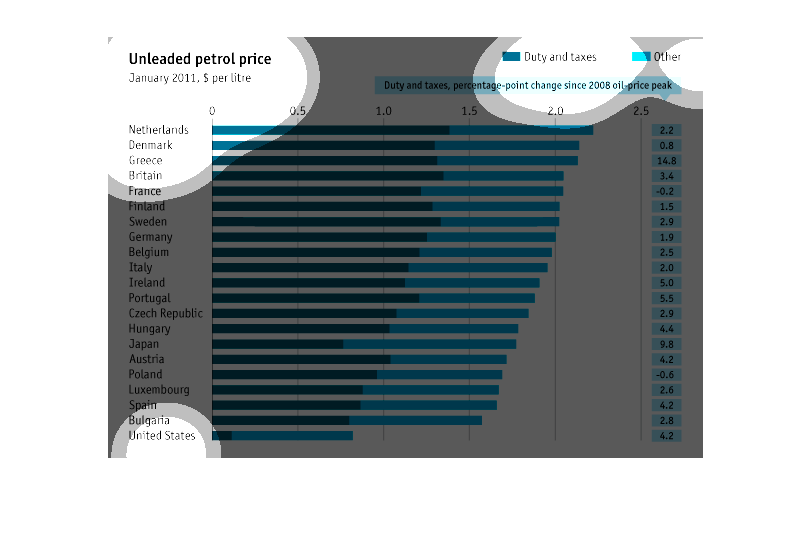
This graph shows the unleaded gas prices. The darker blue shows the "Duty and Taxes" and the
lighter blue shows, "Duty and Taxes, percentage point-change since 2008 oil-price peak". This
graph also shows the difference with many countries.
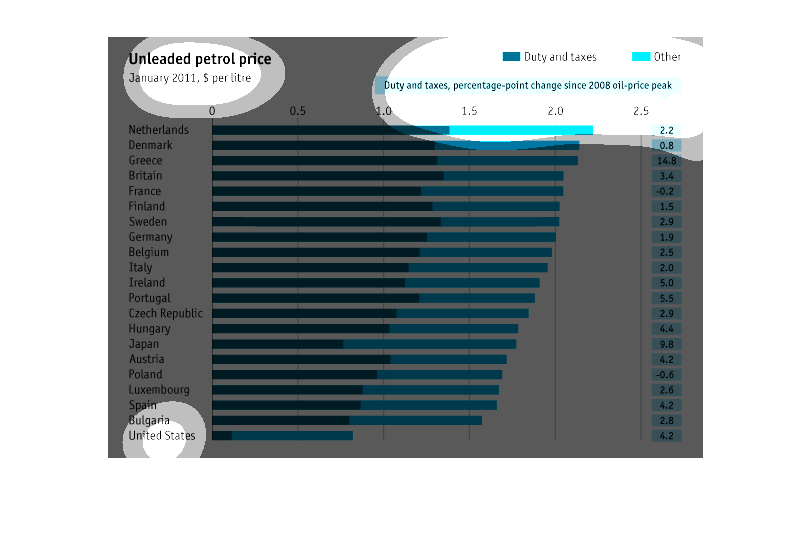
This graph shows unleaded petrol price in 2011 with Netherlands and Denmark having the highest
gas prices and Bulgaria and the United States having the lowest.
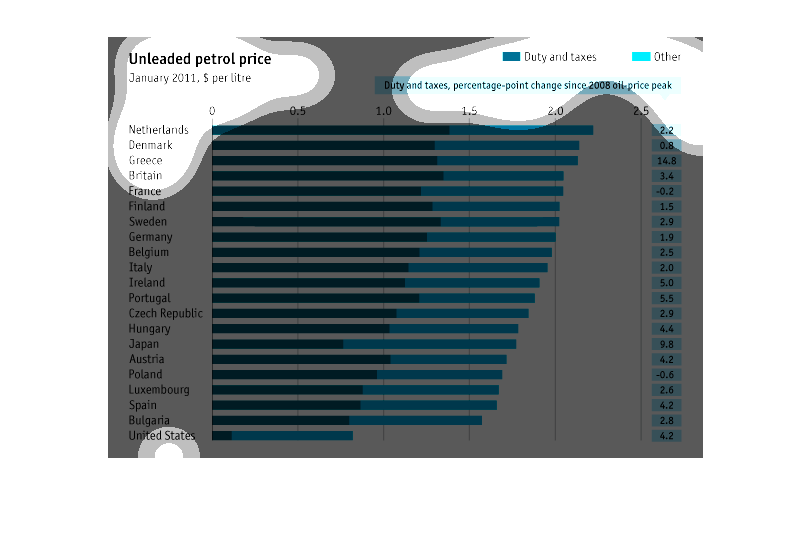
This is a graph of unleaded petrol prices, from january 2011, ranked by world countries, and
color coded by duty and taxes, and 'other.' Its ranked by a percentage of the 2008 oil peak
price.
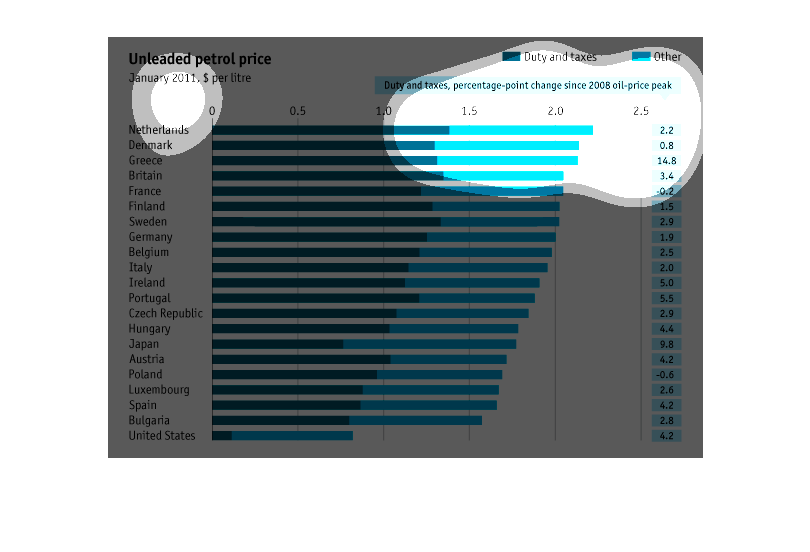
This chart shows the price of gas in various countries in Europe, Asia, and the United states.
It shows the percentages on how much is paid for in gas and how much is paid for in taxes
on gas.
This image graph formatted in bar shows countries that have Unleaded petrol prices for January
2011. Also included is duty and taxes as well as other categories.

This graph shows the unleaded petrol prices in different countries since 2008. It appears
to be charting the prices including taxes across different countries.
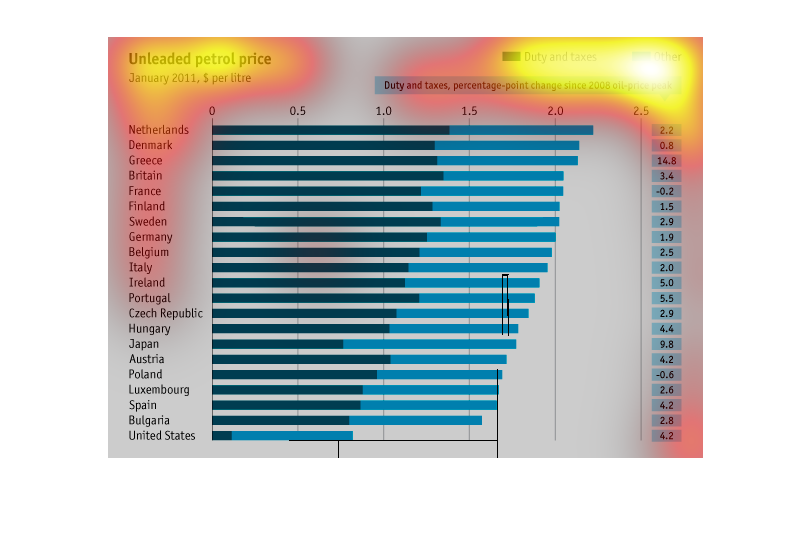
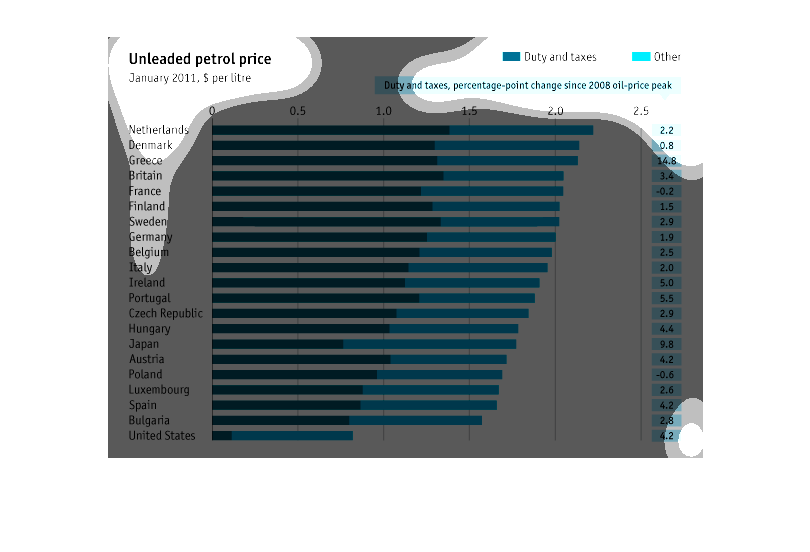
A chart showing unleaded petrol price in January 2011. It also shows the relationship between
duty and taxes for each country and the percentage change since 2008.
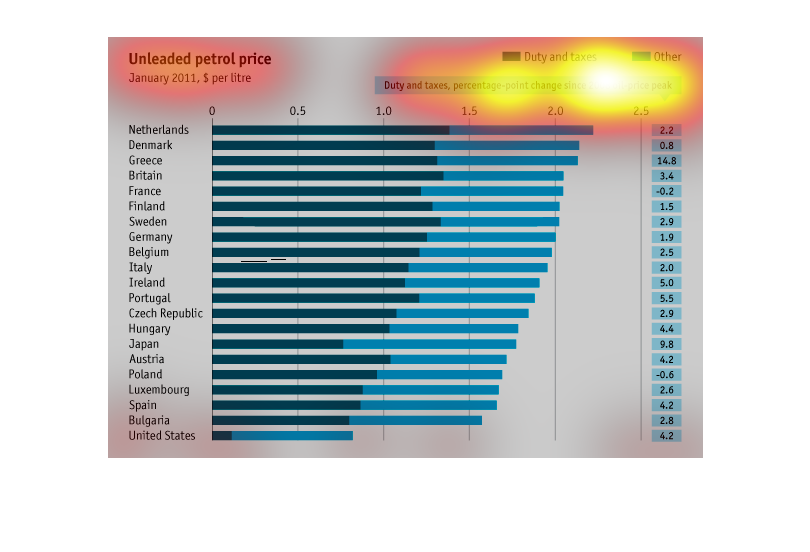
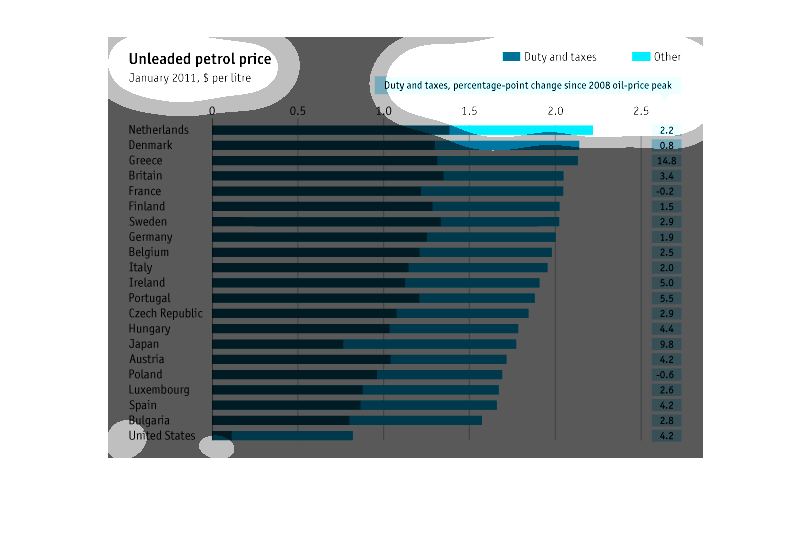
The chart shows Unleaded Petrol Price in $ per liter. It has two categories for the price,
"Duty and taxes" and "Other." It also has the percentage point change in duty and taxes since
the 2008 peak. Netherlands has the most duty and taxes, but not the highest change. The United
States has the least duty and taxes.
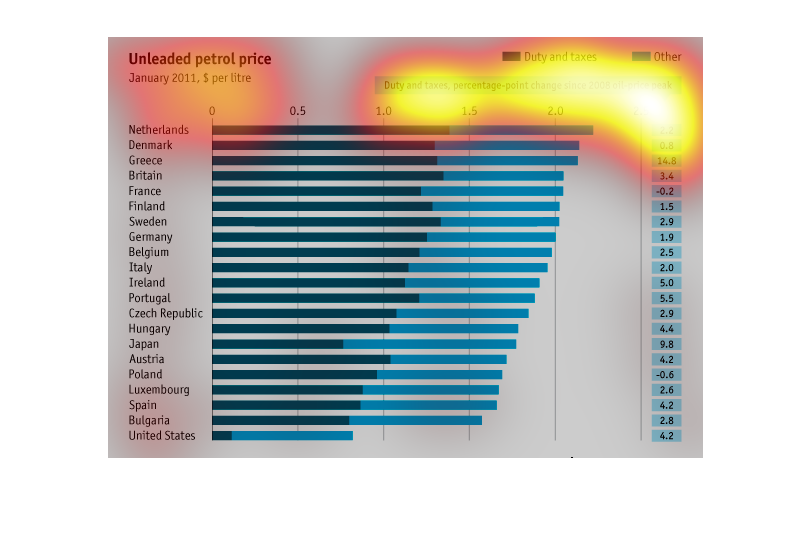
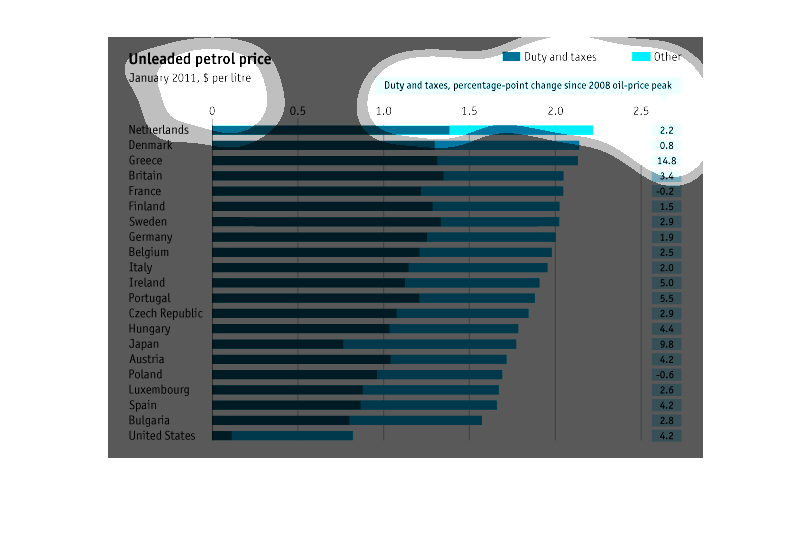
Unleaded Petrol prices as dollar per liter in January 2011. Figures for duties and taxes included.
Showing Netherlands, Denmark Greece, Britain and France are most expensive