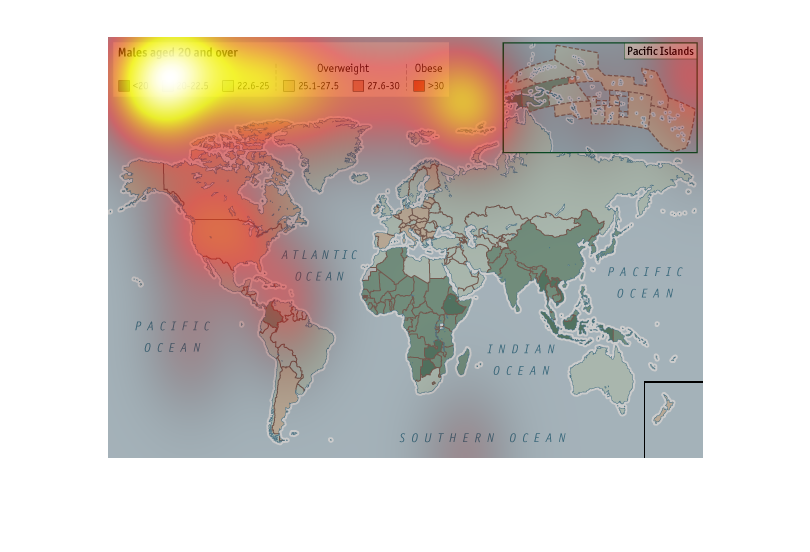
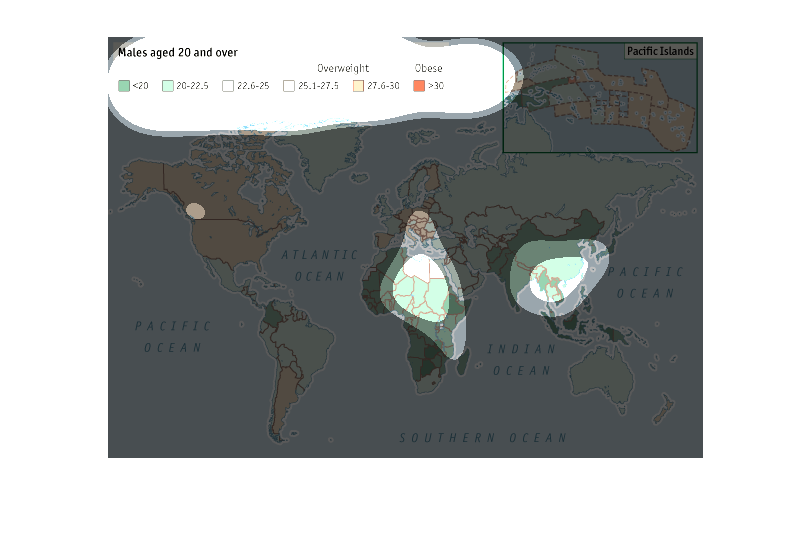
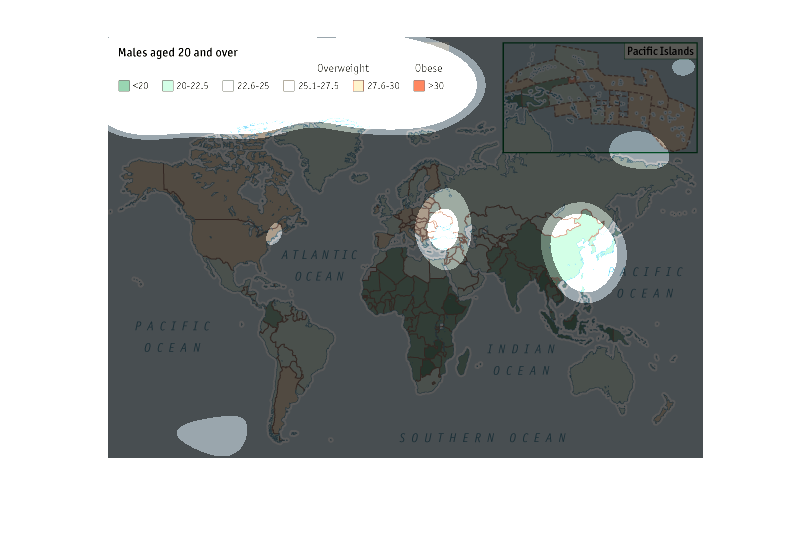
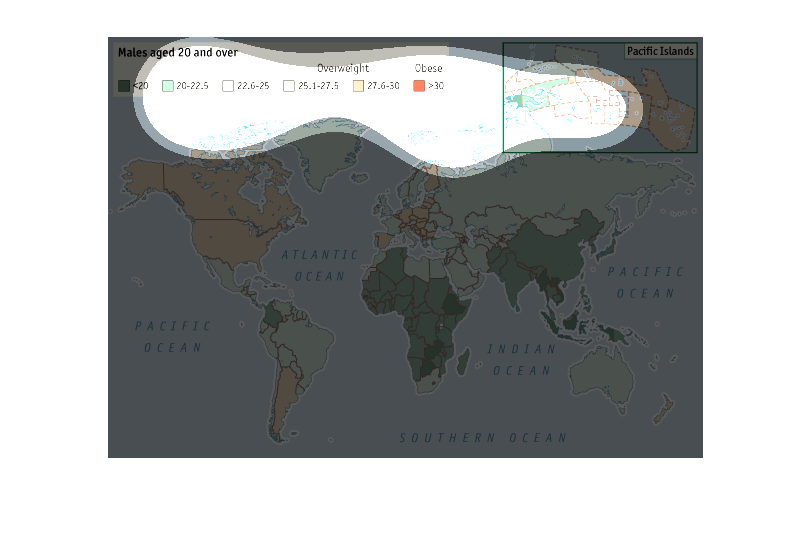
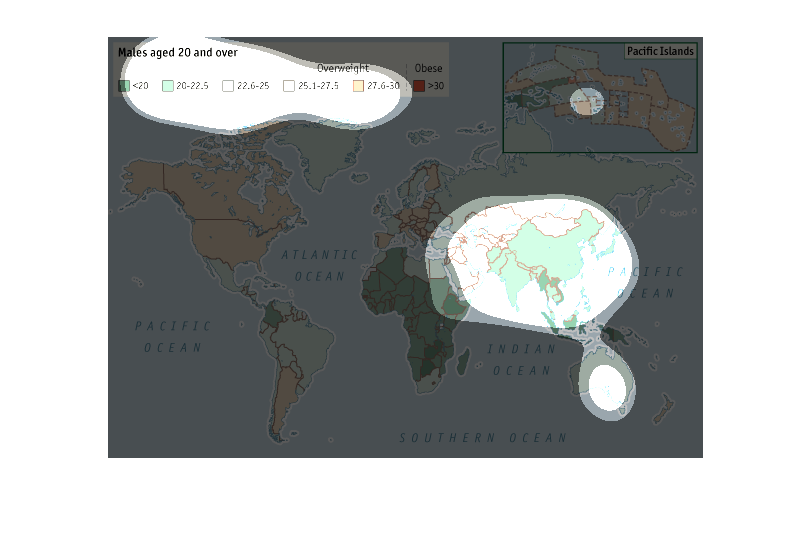
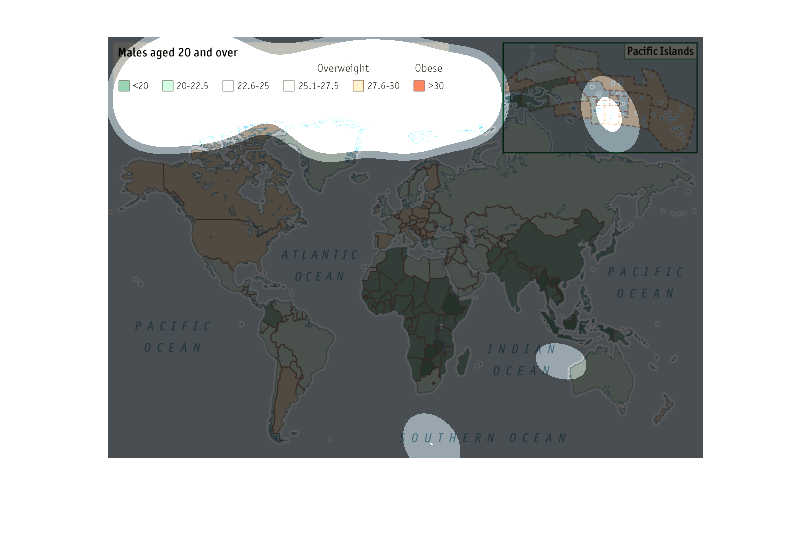
This is a world map of the BMI of males aged 20 and over. Most of North America's males are
overweight. Africa and China are underweight. The rest of the world is an even mix.
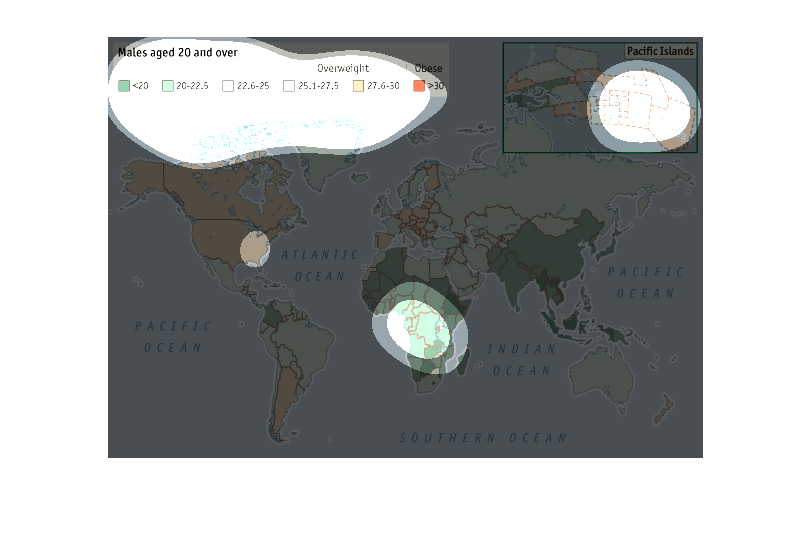
This graph shows the average bmi for males age 20 and over as they are distributed across
the earth. The BMIs in Africa,South America and Southeast Asia are much lower than those in
Europe and North America. It appears that the vast majority of males over 20 in North America
are overweight.
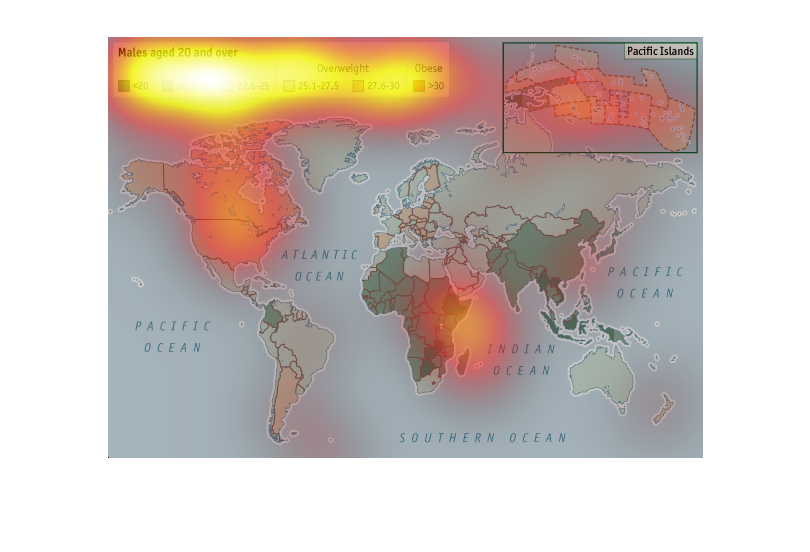
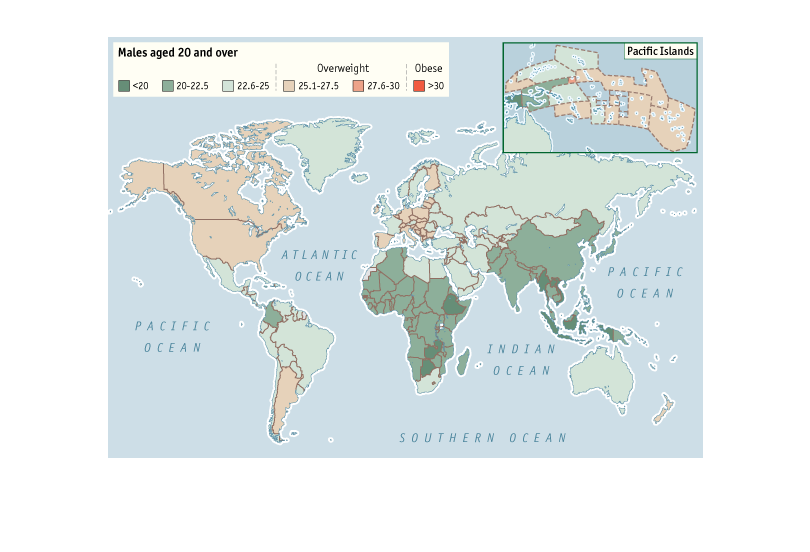
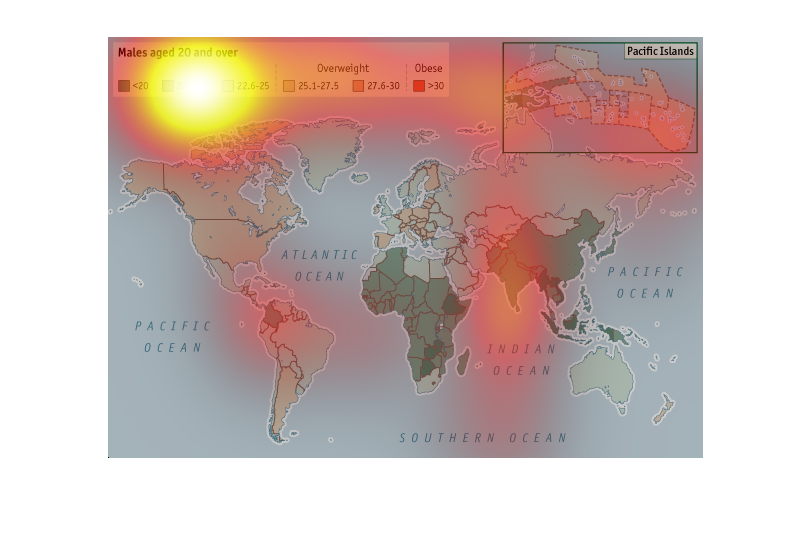
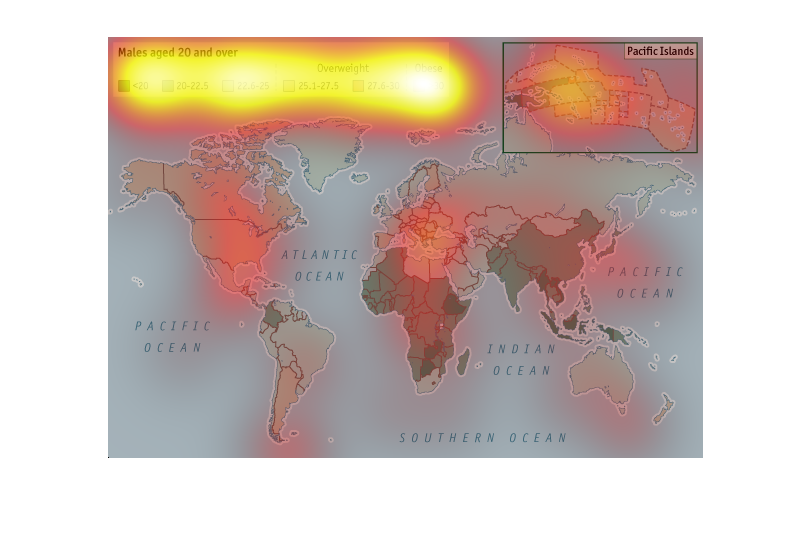
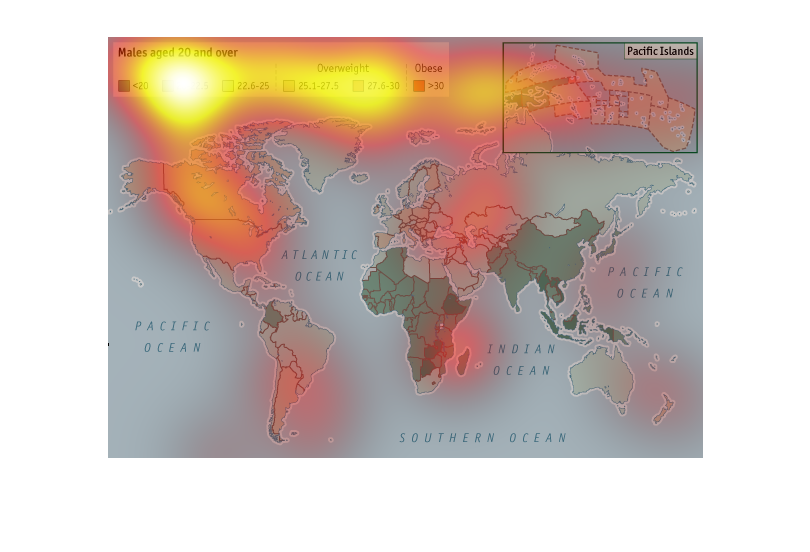
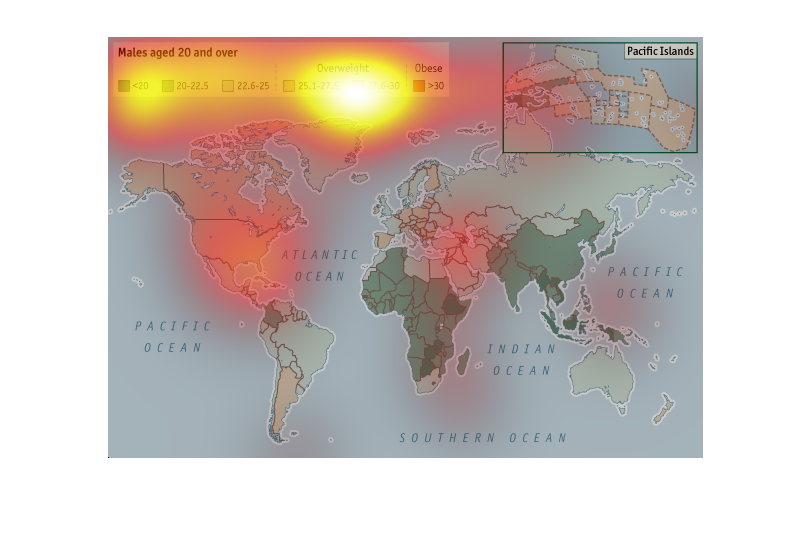
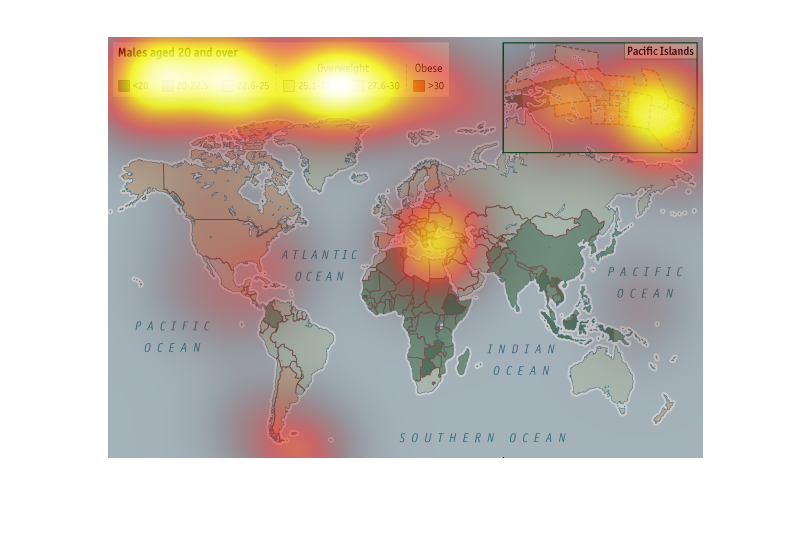
This world map shows males over the age of 20 who are overweight by country. Parts of Africa
and Asia show the lowest incidents of obesity, while the United States, Canada and part of
Europe show the highest incidents of obesity.
A map colored coded for Males ages 20 and over and their weight as expressed in BMI index.
Each country coded for BMI of these adult males on a map chart
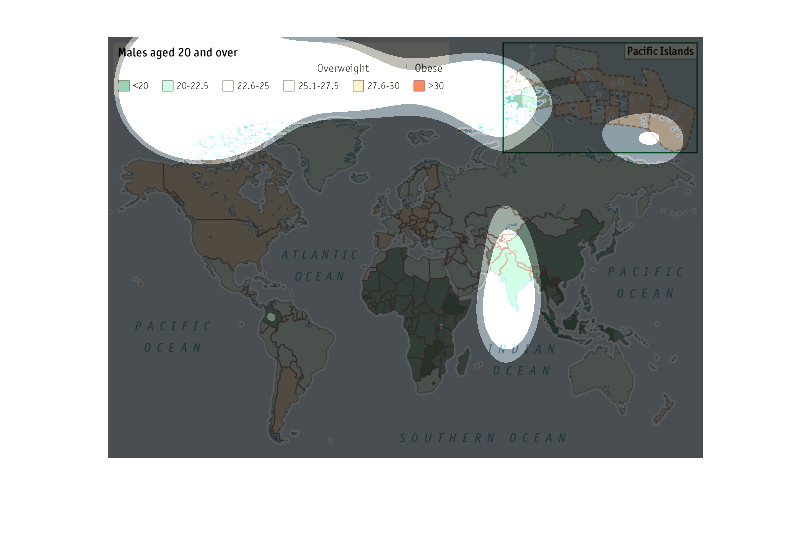
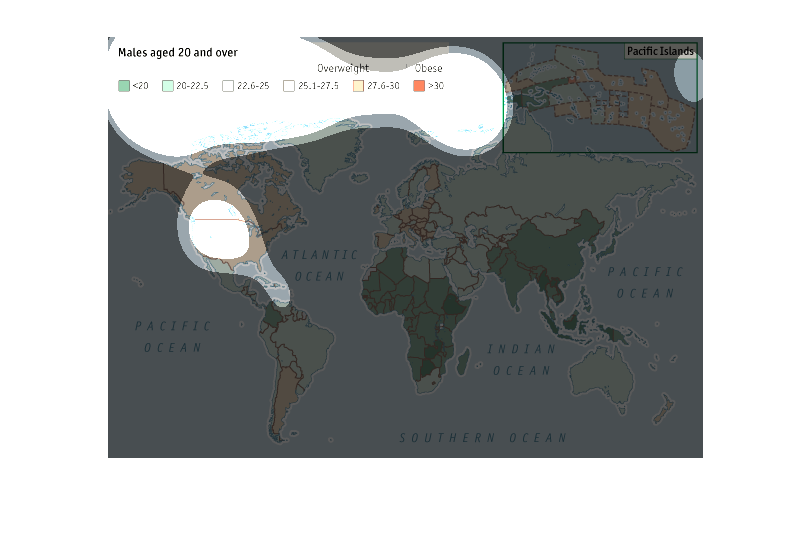
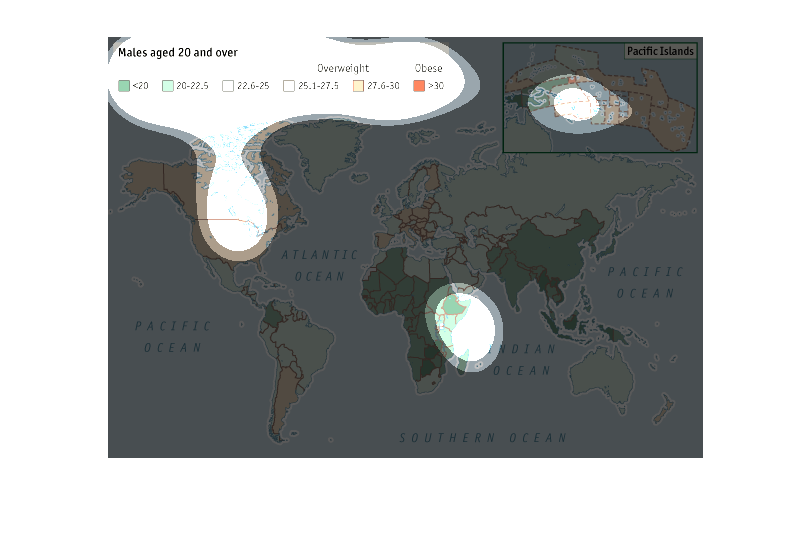
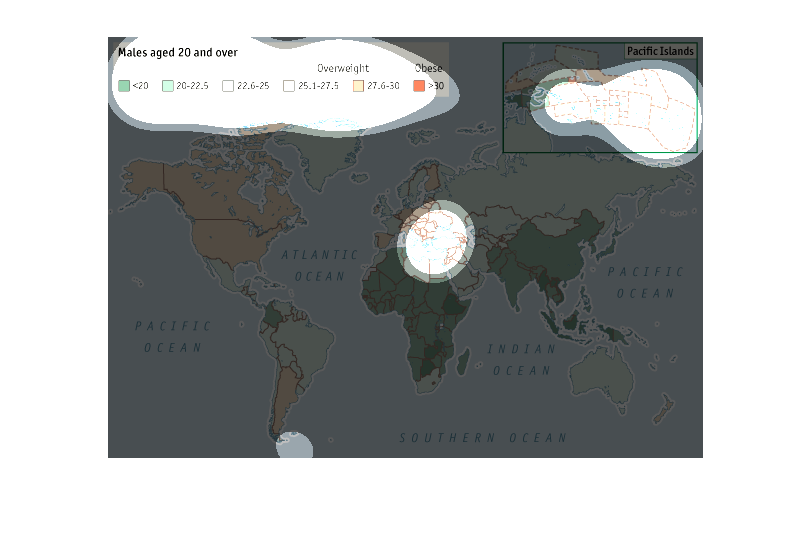
This map is not very clear in what it is displaying.  There is a lack of details in the name
to know exactly what it is displaying.  I believe that it is showing where in the world the
highest rates of obesity and overweight males over 20 reside.  Based on the map Africa and
Southeast Asia have the most males that are at a normal or below normal weight, while North
America, Central Europe, and the southern tip of South America have the highest rates of obesity
and overweight males over 20.
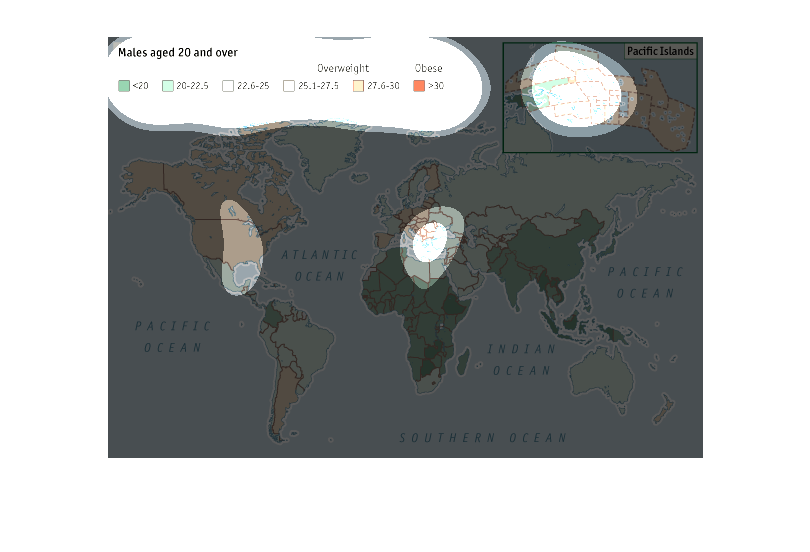
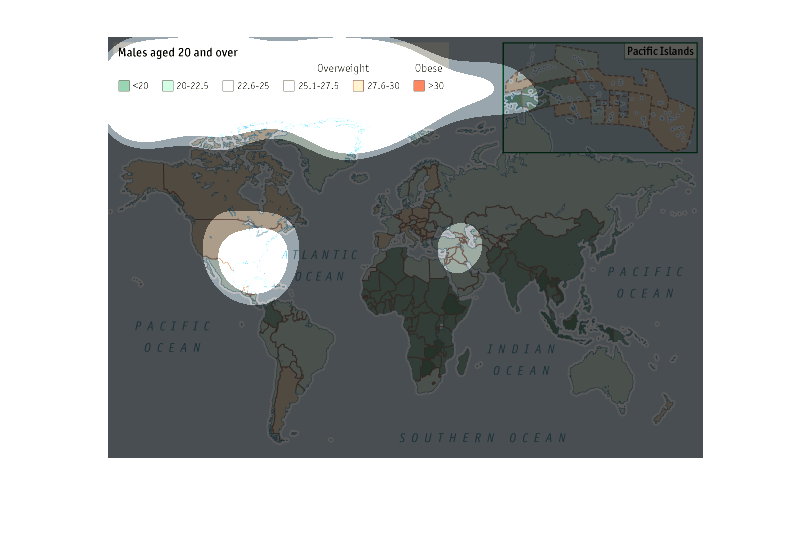
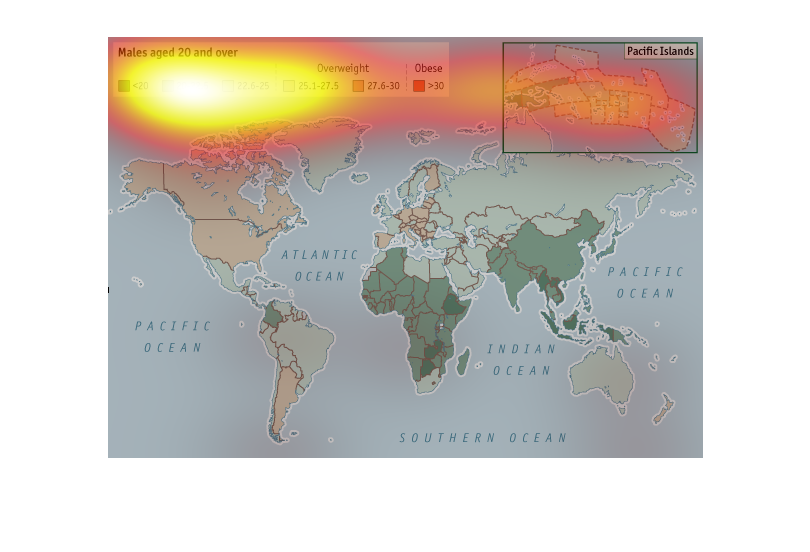
This graph represents males aged 20 and over and their weight. It is color-coded red to green
with green meaning <20 and red >30. It is not stated what these numbers refer to, but it possibly
refers to BMI.  Africa and part of Asia are colored green, while North America, part of South
America, and several countries in Europe are in the mid-ranges. Pacific islands are also shown
zoomed in.
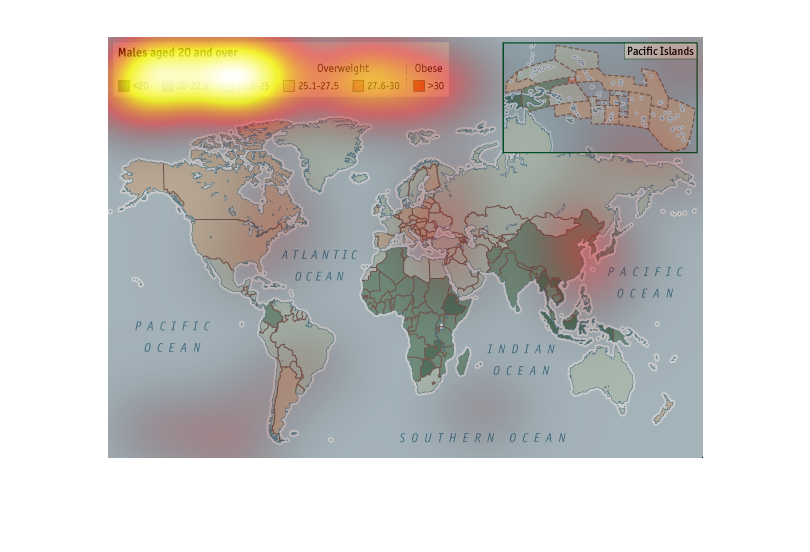
This chart from the Economist shows the data related to the BMI (or who is overweight and
obese) around teh world. It shows the percentage of overweight adults
This image shows the relationship between different countries around the world in which males
aged 20 and over that are overweight and obese. Many of which are in the US and Britain.
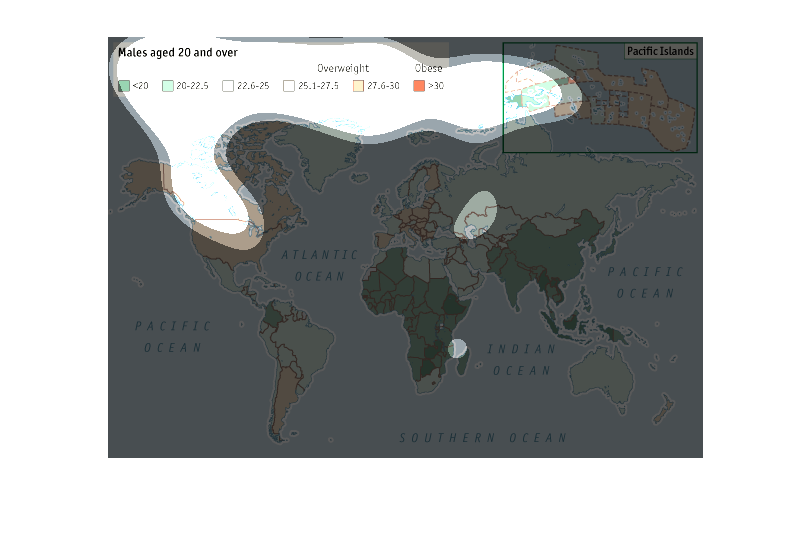
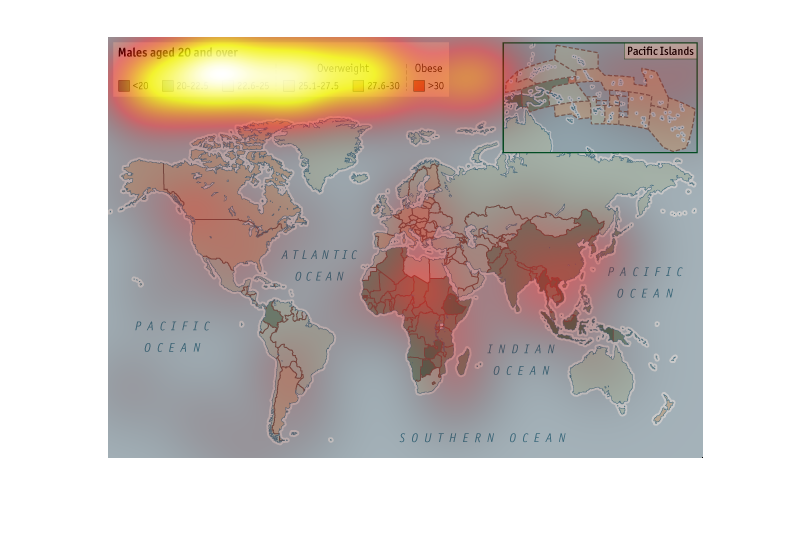
The image is a world map showing the location of males 20 and over by Body Mass Index by country.
Green represents under and within healthy BMI, brown is overweight, and red is obese. The
map is not to scale, and there is map detail in the upper right corner of the Pacific Islands.
Lowest BMIs for males over 20 by continent are Africa and Asia.
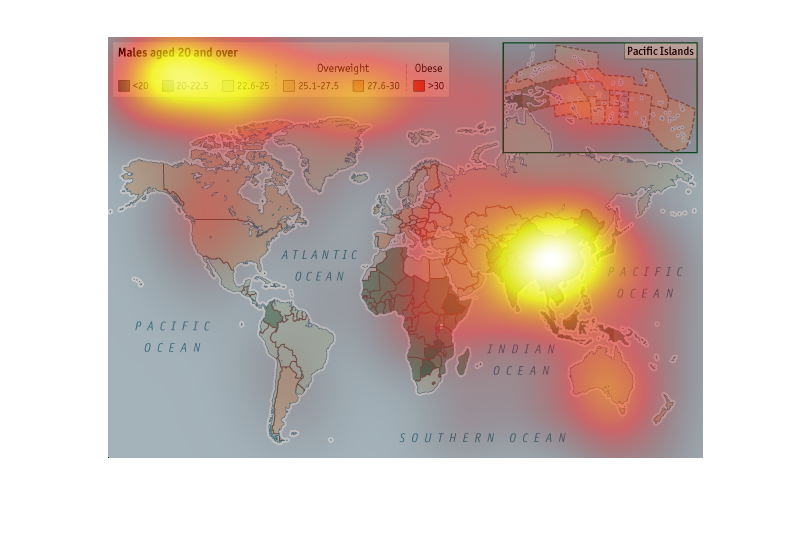
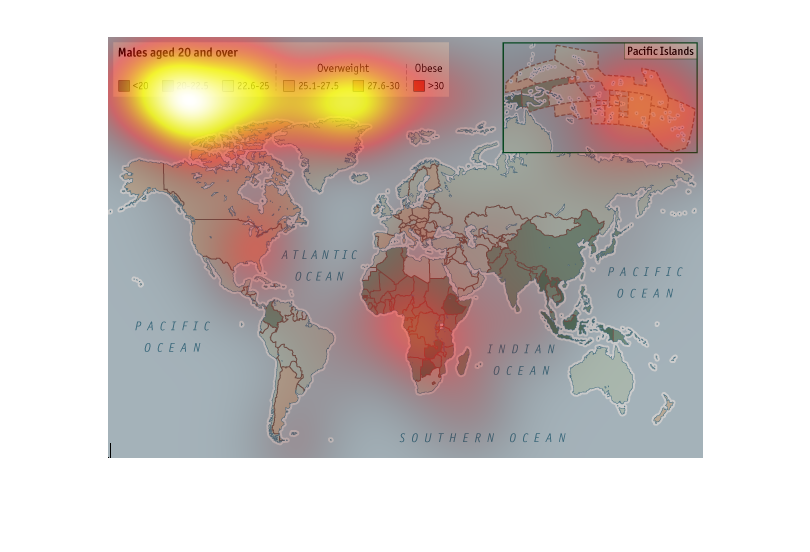
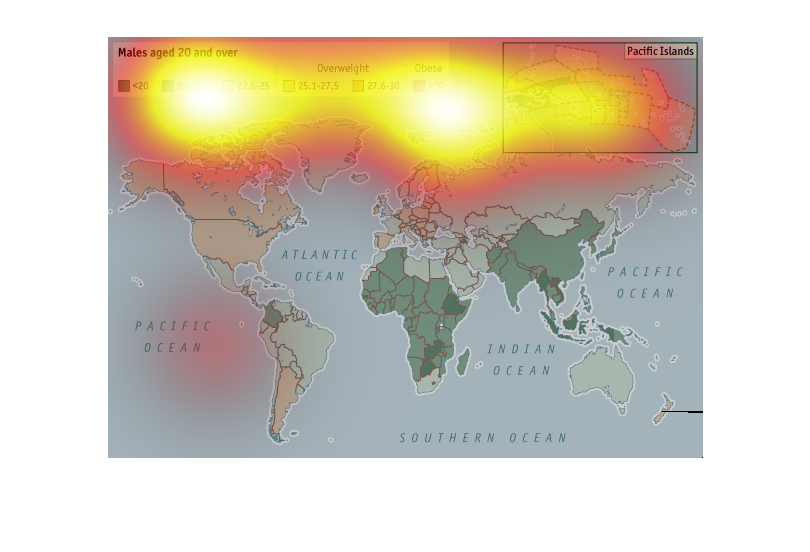
This graph shows males 20 and over in the world, and is further divided into the mass body
index for the males throughout the planet. The United States has the highest amount of males
over 20 with a bmi of over 25.1, while Africa has the lowest with a bmi for their overall
males over 20 of less than 20.
This is a map of the world showing males aged 20 and over and their body mass index, including
those overweight and obese.  The United States male population is largely overweight.
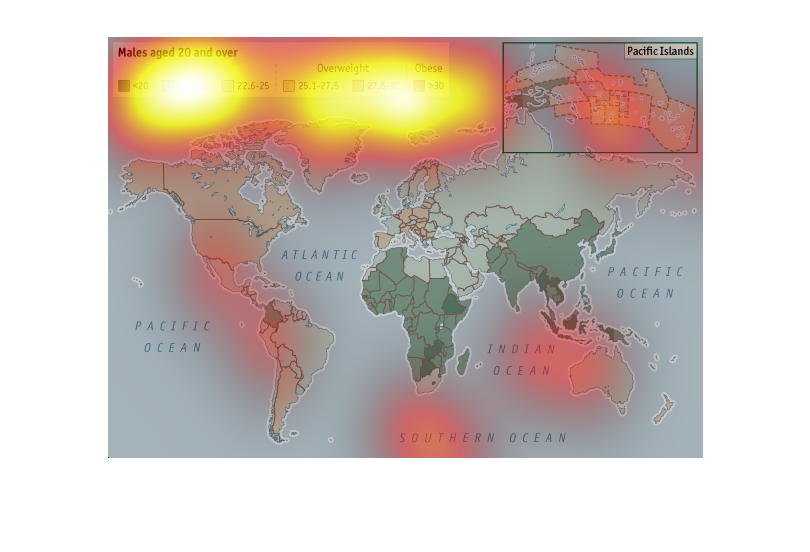
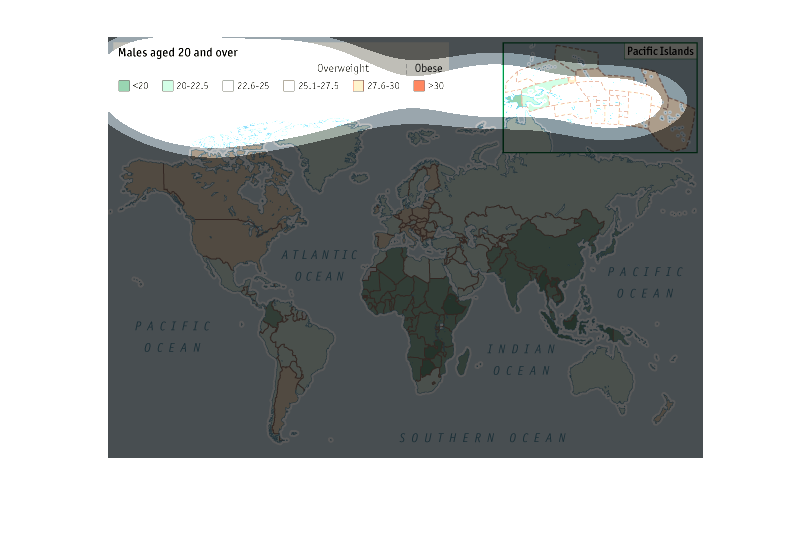
This photo depicts a 2D map of the world with different colors corresponding to the average
BMI of males aged 20 and over. Males with a BMI less than 20 were primarily found in Africa
as well as Southern Asia. Overweight males were found in North America, Argentina, and the
Pacific Islands. Russia, most of South America, and Australia all mostly contained males of
healthy BMIs in the range of 22.6-25.
This chart describes males aged 20 and over who are overweight or obese. The different percentages
on the chart are represented by six different colors.
This map shows the percentages of males who are twenty years and older who are obese. The
map is of all the areas in the world.  Colors are used to show the different percentages.