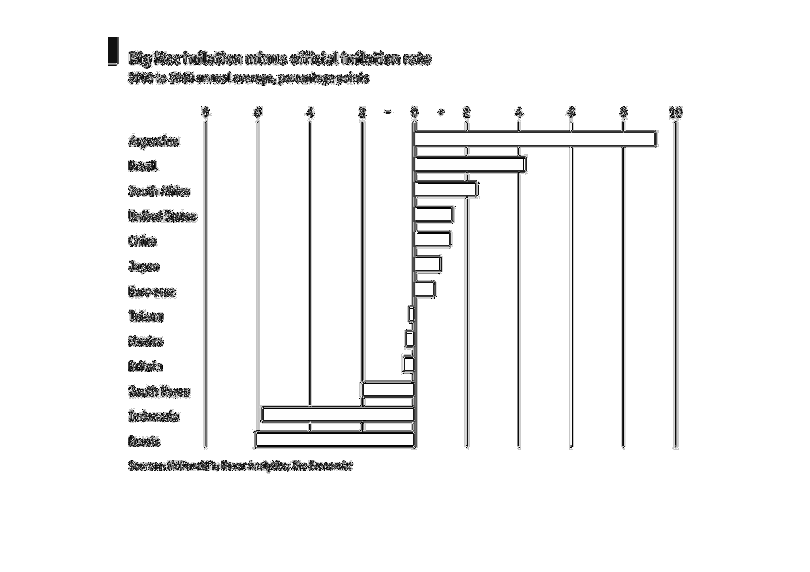
The title of this graph is, 'Big Mac inflation minus official inflation rate'.  Data was collected
from 2000-2010.  Descending the left hand side of the page are a list of about 20 countries.
  Bar graphs extend to the right and left reflecting positive and negative movement.
Error using .*
Matrix dimensions must agree.

Error in plotSpotlight (line 30)
    output = repmat(a,[1 1 3]).*single(im)/255;

Error in plot_individual_user_maps (line 49)
        [heat] = plotSpotlight(im,heatmap,3);