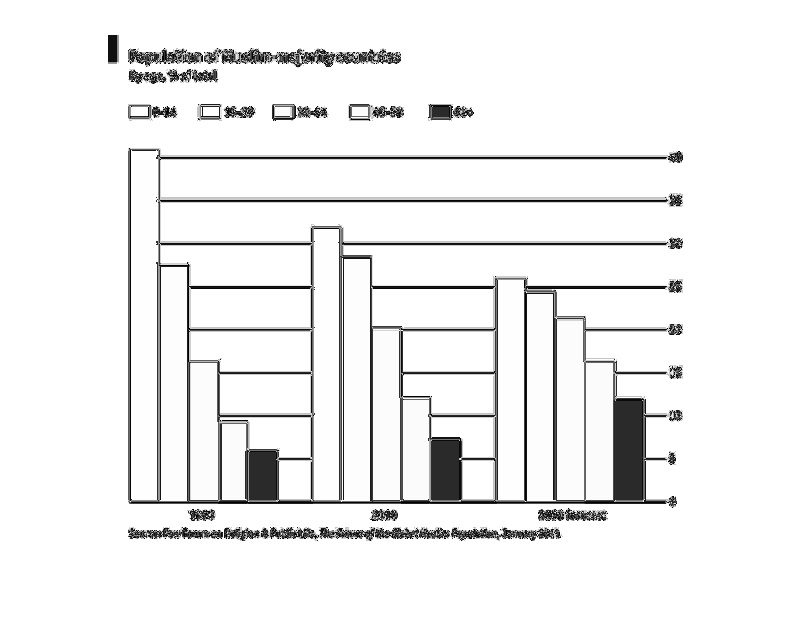
This graph describes the population of Muslim-majority countries by age. According to the
graph the percentage aged 0-14 from 1990-2030 should significantly, and continually, decrease.
However, the remaining age groups will continue to rise, with the exception of the 15-29 group,
which is expected to decrease again around by 2030.
Error using .*
Matrix dimensions must agree.

Error in plotSpotlight (line 30)
    output = repmat(a,[1 1 3]).*single(im)/255;

Error in plot_individual_user_maps (line 49)
        [heat] = plotSpotlight(im,heatmap,3);