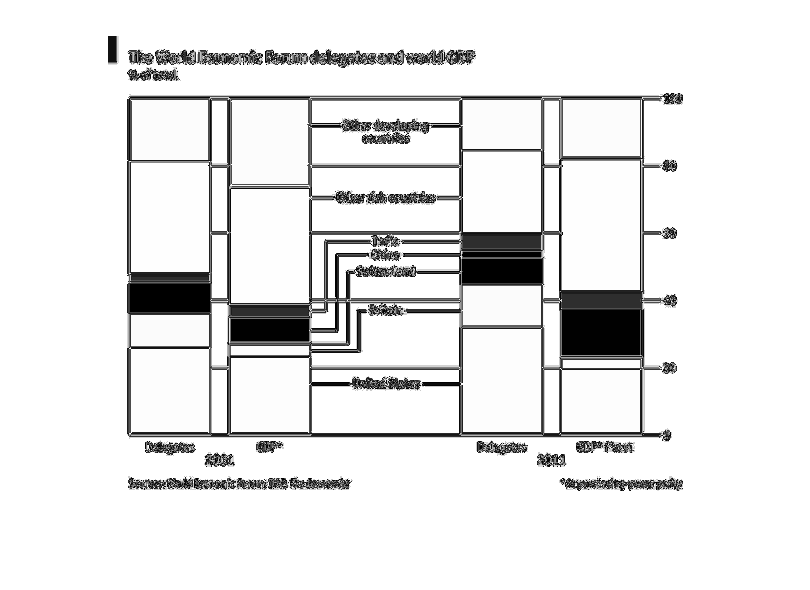
Looks like this chart is about the worlds economics. It has to to do with the GDP and delegates
of the world. It shows years 2001 to 2011. Looks like the years are fairly equal.
Error using .*
Matrix dimensions must agree.

Error in plotSpotlight (line 30)
    output = repmat(a,[1 1 3]).*single(im)/255;

Error in plot_individual_user_maps (line 49)
        [heat] = plotSpotlight(im,heatmap,3);