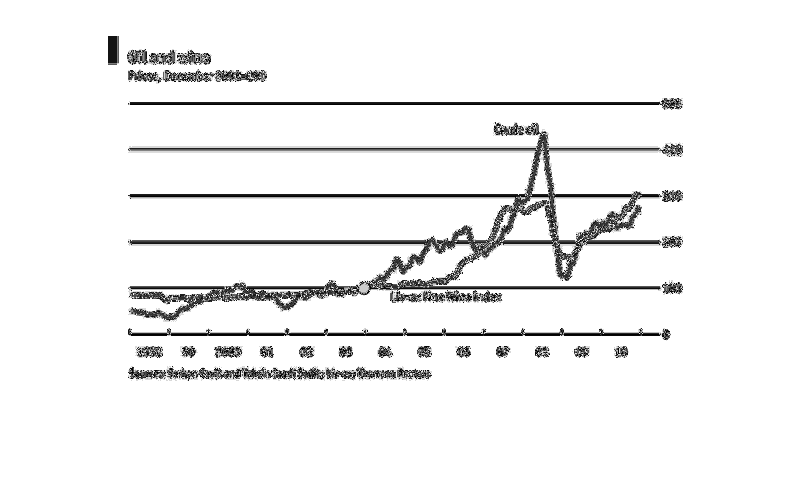
This line graph compares the prices of oil and wine over time. The prices rose steadily from
1998 to 2007, where they took a drop. But then they started rising again.
Error using .*
Matrix dimensions must agree.

Error in plotSpotlight (line 30)
    output = repmat(a,[1 1 3]).*single(im)/255;

Error in plot_individual_user_maps (line 49)
        [heat] = plotSpotlight(im,heatmap,3);