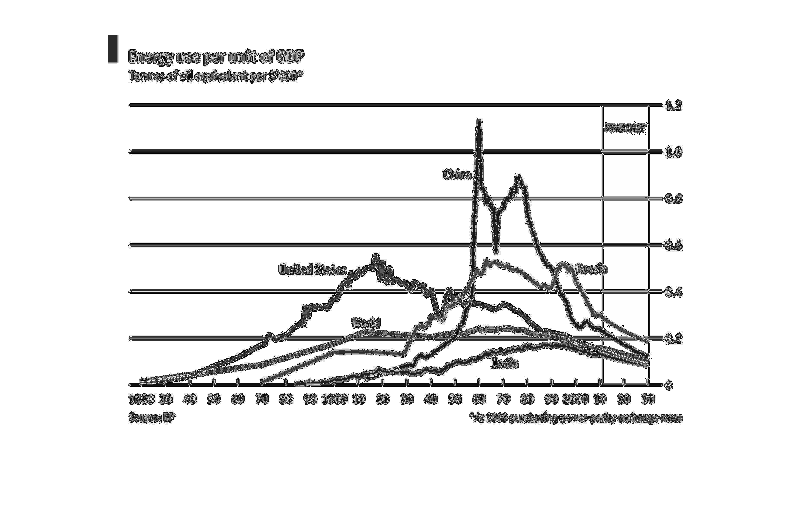
This graph shows the energy used per unit of GDP based on the tonnes of oil equivalent per
$'000, (at the  2009 purchasing price) The graph was conducted by BP.  The information was
collected starting in 1820, and goes thru forecasting thru 2030.
Error using .*
Matrix dimensions must agree.

Error in plotSpotlight (line 30)
    output = repmat(a,[1 1 3]).*single(im)/255;

Error in plot_individual_user_maps (line 49)
        [heat] = plotSpotlight(im,heatmap,3);