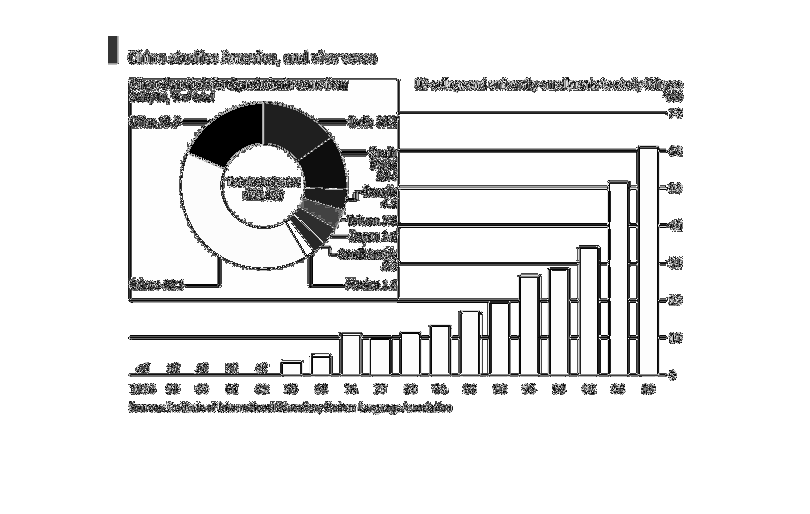
This graph shows the gradual increase in the studies of China and America foreign exchange
student enrollment. The lowest enrollment at 5% occurred in 1965. The highest enrollment at
60% occurred in 2009.
Error using .*
Matrix dimensions must agree.

Error in plotSpotlight (line 30)
    output = repmat(a,[1 1 3]).*single(im)/255;

Error in plot_individual_user_maps (line 49)
        [heat] = plotSpotlight(im,heatmap,3);