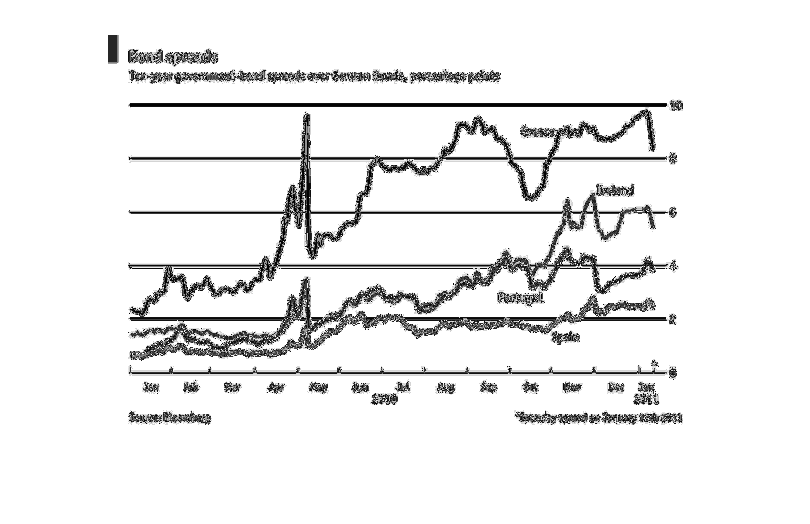
This chart shows the ten-year government spread of bonds over german bunds.  This chart is
based on percentage point and it shows a gradual incline over the years.
Error using .*
Matrix dimensions must agree.

Error in plotSpotlight (line 30)
    output = repmat(a,[1 1 3]).*single(im)/255;

Error in plot_individual_user_maps (line 49)
        [heat] = plotSpotlight(im,heatmap,3);