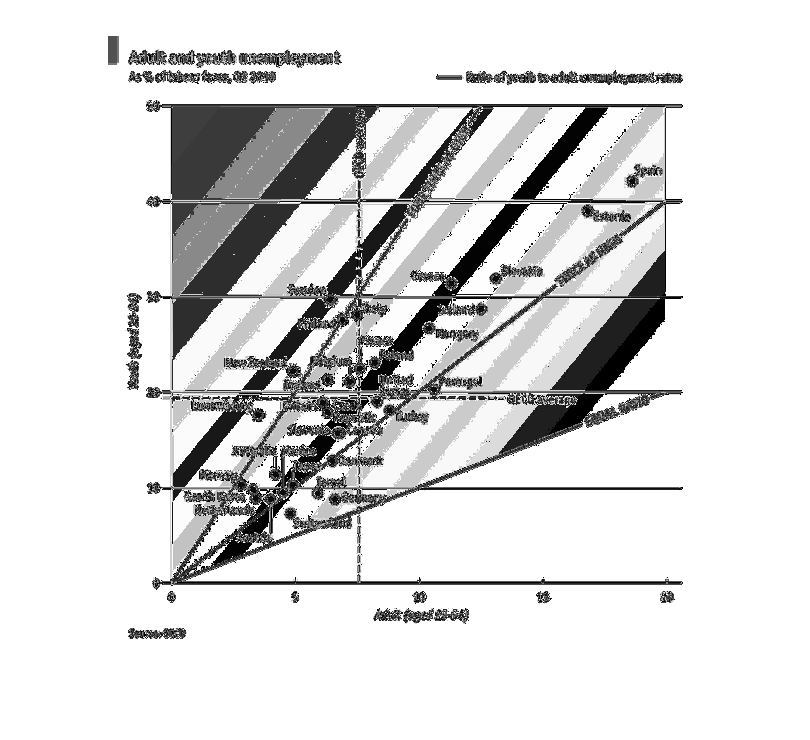
This chart compares adult and youth unemployment rates on a Cartesian plane.  The chart not
only positions countries according to their relative ratio of adult/youth unemployment, it
also provides lines that indicate the multiples at which the ratio differs.
Error using .*
Matrix dimensions must agree.

Error in plotSpotlight (line 30)
    output = repmat(a,[1 1 3]).*single(im)/255;

Error in plot_individual_user_maps (line 49)
        [heat] = plotSpotlight(im,heatmap,3);