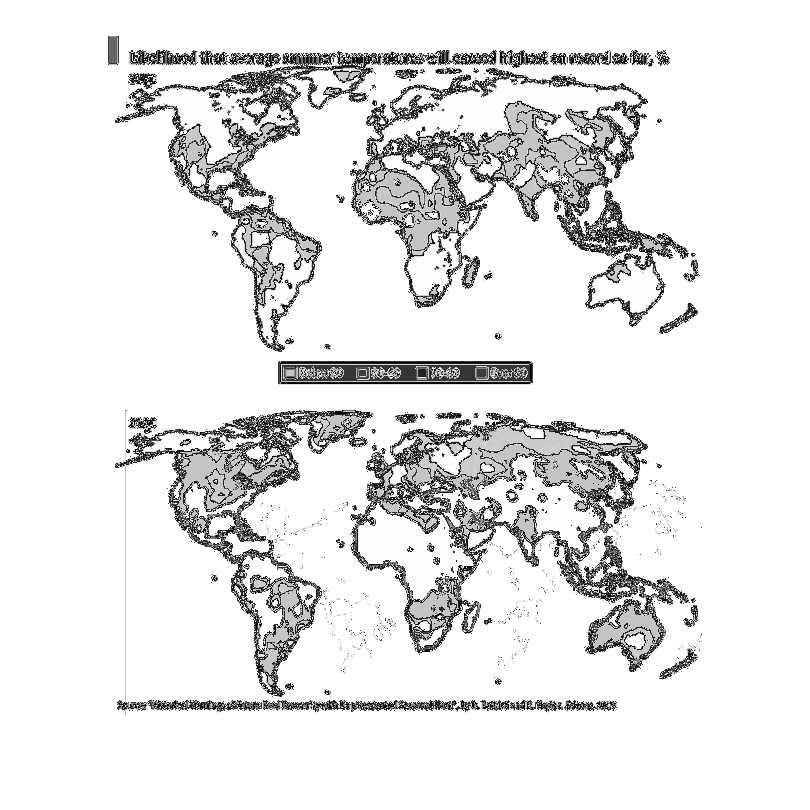
This is a graph that shows the likelihood that summer temperatures will rise above their highest
record by the year 2050. The areas highlighted in red look as if they're the hot spots where
the temperature will be the hottest that it's ever been.
Error using .*
Matrix dimensions must agree.

Error in plotSpotlight (line 30)
    output = repmat(a,[1 1 3]).*single(im)/255;

Error in plot_individual_user_maps (line 49)
        [heat] = plotSpotlight(im,heatmap,3);