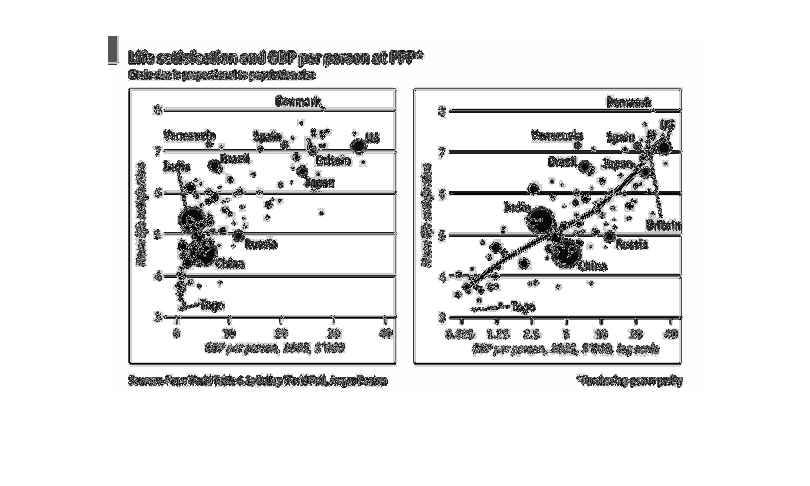
Life Satisfaction and GDP per person at PPP, the mean life satisfaction graphed in relation
to population size where circle size represents population size
Error using .*
Matrix dimensions must agree.

Error in plotSpotlight (line 30)
    output = repmat(a,[1 1 3]).*single(im)/255;

Error in plot_individual_user_maps (line 49)
        [heat] = plotSpotlight(im,heatmap,3);