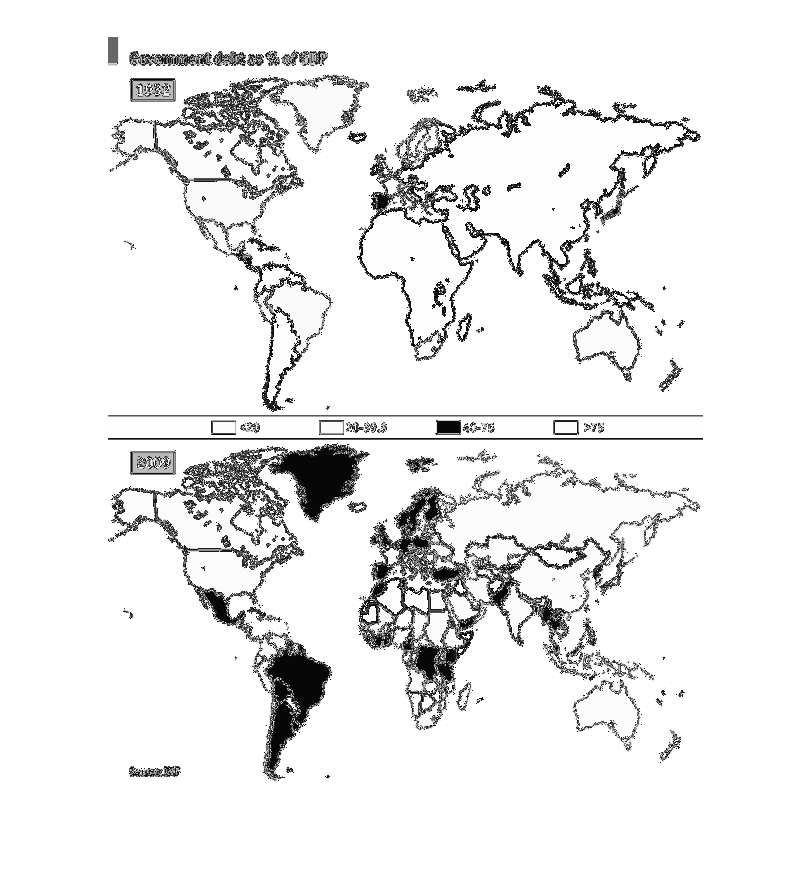
This map shows government debt as a percentage of gross domestic product (GDP) comparing time
periods of 1932 and 2009. This map suggests that overall, the general trend is going towards
higher debt, especially in western countries. Where debt was not present in 1932 for some
countries, it has become a part of their economy.
Error using .*
Matrix dimensions must agree.

Error in plotSpotlight (line 30)
    output = repmat(a,[1 1 3]).*single(im)/255;

Error in plot_individual_user_maps (line 49)
        [heat] = plotSpotlight(im,heatmap,3);