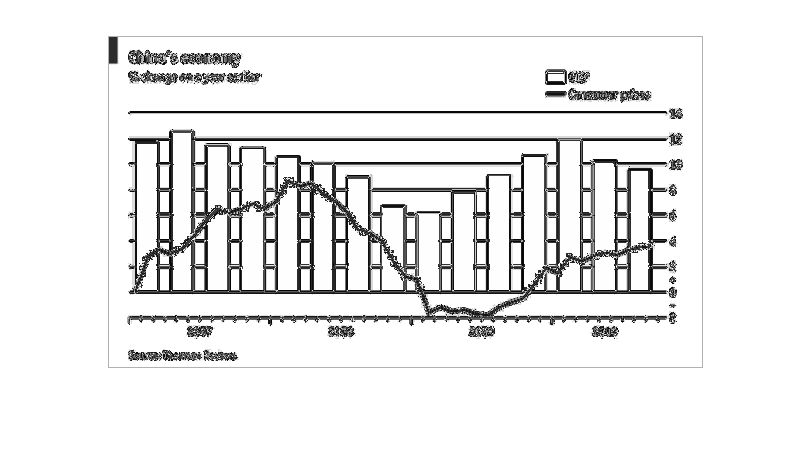
This chart graphs year-over-year percentage changes in China's GDP and consumer prices. There
is one measurement for each quarter between 2007 and 2010.
Error using .*
Matrix dimensions must agree.

Error in plotSpotlight (line 30)
    output = repmat(a,[1 1 3]).*single(im)/255;

Error in plot_individual_user_maps (line 49)
        [heat] = plotSpotlight(im,heatmap,3);